Gold Posts First Weekly Gain in Five as Fed Rate-Hike Bets Cool

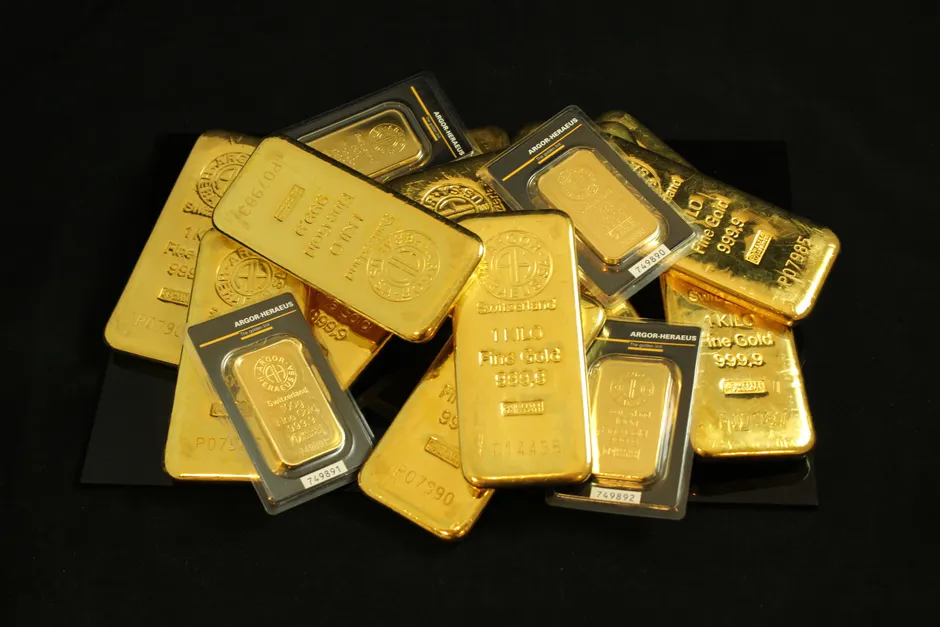
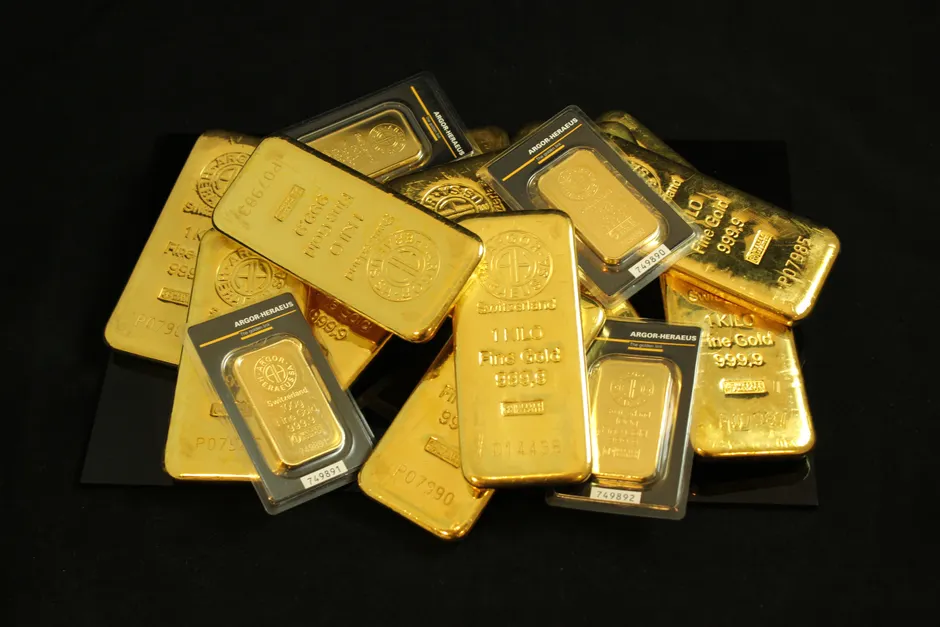
Spot gold traded up 1.3% at $4,174.21 per ounce on July 3, 2026, its highest print since June 23, and on course for its first weekly gain in five sessions, according to Reuters. The metal has held above its 21-day moving average — a level traders track as a near-term momentum signal — suggesting the acute selling pressure of late June has abated, at least for now.
The preceding four weeks were bruising. On June 24, spot gold collapsed 3.3% to $3,973.79, a level not seen in more than seven months, as a firmer dollar and rising Fed rate-hike expectations drove liquidation across the complex, Reuters reported. That session erased a large slice of the gains built earlier in the month: as recently as June 17, spot had been trading around $4,299.89, even as the Federal Reserve held rates steady that day and flagged a hike later in 2026, per Reuters.
The Fed Is the Fulcrum
The June 17 hold was a non-event in itself. Markets had priced it. What moved gold was the forward guidance: a hike signal from the Fed reactivates the opportunity-cost calculus that runs through every gold position. Higher nominal rates lift real yields when inflation expectations are anchored, and real yields are gold's most reliable short-run antagonist. The June 24 selloff was the deferred repricing of that signal once the dollar caught a bid.
The partial recovery began on July 1. Spot bounced 1.6% to $4,071.04 after touching its lowest level since November in the prior session, with Reuters attributing the move in part to softer-than-expected U.S. jobs data and comments from Fed Chair Warsh that traders read as tempering near-term hike urgency. Weak payrolls compress the real-yield argument for selling gold; they also raise the probability that any hike, if it comes, arrives later rather than sooner.
Where the Analysts Stand
In late June, sell-side consensus — as reported by Reuters — had coalesced around $4,300/oz for Q3 2026 and $4,600/oz for Q4. Those numbers sit well above current spot, implying the analyst community views the June correction as cyclical rather than structural.
That framing has precedent in the forecaster record. UOB, in its October 2025 FX and rates outlook, put gold at $3,900/oz across 2026 — a figure spot blew through convincingly in the first half of the year. An earlier UOB note from July 2025 had called $3,500/oz by end of Q4 2025; that, too, proved conservative. Forecasters have been consistently behind the tape on gold throughout this cycle, which is worth factoring into how much weight to attach to the current Q4 2026 consensus of $4,600.
What's Driving the Underlying Bid
Three structural forces have kept gold elevated well beyond what traditional rate-sensitivity models would predict. Central bank accumulation — particularly from EM reserve managers diversifying away from dollar-denominated assets — has added a demand floor that is largely insensitive to short-run rate moves. Geopolitical risk premia, including tensions around US-Iran relations that Reuters flagged as a headwind to gold on July 1 when peace prospects briefly firmed, have repeatedly provided a catch-bid on dips. And retail and institutional demand from Asia, where gold carries cultural and portfolio-diversification functions distinct from Western frameworks, has remained durable.
None of that insulates gold from a genuine Fed tightening cycle. UOB's broader macro view, set out in its Q4 2025 quarterly outlook, assumed no broad-based recession across the US and Singapore through 2025–2026 and projected a terminal Fed Funds Rate of 3.25%. If that terminal rate is revised materially higher — which is what the market began pricing after the June 17 guidance — the opportunity cost of holding a zero-yielding asset rises in a way that structural demand can only partially offset.
The Level to Watch
The June 24 low of $3,973.79 is now the line in the sand. A sustained break below sub-$4,000 would bring November 2025 lows into scope and likely force a reassessment of the consensus Q3 and Q4 targets. Conversely, reclaiming $4,300 — the June 17 vicinity and the Q3 analyst consensus — would reframe this past fortnight as a shakeout rather than a trend reversal. As of July 3, the market is threading between those two interpretations, with the weight of short-term momentum just edging toward the bulls.
The Fed's next move will settle the argument, one way or the other.