Oil Keeps Flowing, but Prices Stay High. Here's Why.
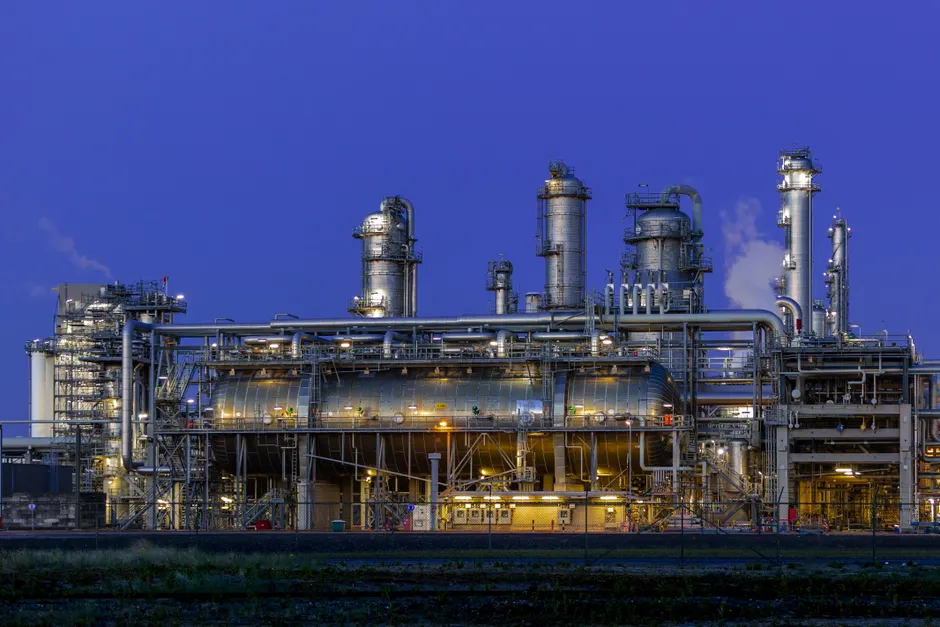
Oil prices settled more than $3 higher on Friday, October 23, 2026, reaching their highest level in nearly six months. The jump followed Houthi attacks in Saudi Arabia, which raised worries about supply.
Six days later, The Wall Street Journal ran a story under the headline "Oil Is Gushing Out of the Gulf. Why Are Prices Still Above $100 a Barrel?" It is a fair question. The answer has less to do with oil flowing out of the Gulf and more to do with how much oil is sitting in storage.
The Energy Information Administration (EIA), the statistics arm of the U.S. Department of Energy, estimated that global oil inventories fell by an average of 1.9 million barrels per day in the third quarter of 2026. A barrel is the standard unit for buying and selling oil. The "per day" part measures a flow, meaning how much changes each day. A drop of 1.9 million barrels a day means the world used roughly that much more oil each day than it produced, and the difference came out of storage.
The same agency projects a further average decline of 0.7 million barrels per day in the fourth quarter. That is a slower pace, but it is still a decline.
Think of storage as a savings account. When you spend more than you earn, you dip into savings. The smaller the balance gets, the less room you have to handle a surprise bill. Oil stocks work the same way, serving as the buffer between supply and demand.
In my view, the storage numbers matter more than pictures of oil gushing from a well or a terminal. A picture shows one place. The price reflects what the next barrel is worth and what traders expect to happen next, and the two can point in different directions for weeks. When prices rise after a supply disruption instead of falling, it suggests the market has few spare barrels to spare.
For ordinary households, the key question is how much of this reaches the gas pump, the furnace, and the delivery truck. The EIA publishes weekly prices for U.S. regular gasoline and on-highway diesel. It also runs a separate update on heating oil and propane from October through March, the heating season. Crude oil is only one piece of the cost. Refining costs, regional stocks, and seasonal demand for heating and diesel fuel all sit between a $100 Brent price, the benchmark for crude sold internationally, and what you actually pay.
The EIA's Weekly Petroleum Status Report also covers the week ending October 23, 2026. It tracks crude oil and major products, including gasoline, diesel, jet fuel, residual fuel, and propane. Those weekly numbers show most directly whether the quarterly decline is speeding up or slowing in U.S. tanks. People who want to test the idea that stocks are tightening usually check there first, then the monthly Petroleum Supply Monthly report, which breaks down production, imports, exports, and inventories in more detail.
The practical question is less whether the headline is accurate. Its premise holds up, based on the agency data and the price move itself. The harder question is how long a market with shrinking stocks and an active supply disruption can keep prices above $100 without a change in demand, a change in oil flows, or a change in the extra risk premium, the added cost traders attach to the Gulf. Those are three separate things. In my view, any forecast that claims to know the path of all three deserves the same skepticism I would give any single-number call on oil.


