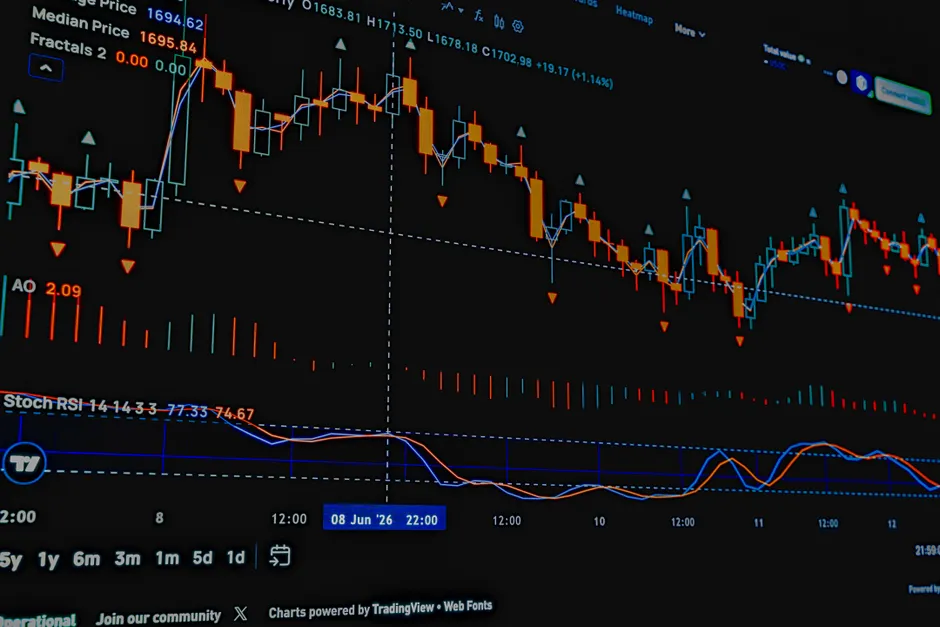
The S&P's 14% Gain Is Narrow: Tech Drives, Breadth Lags

The S&P 500 was up 14% for 2026 as of Oct. 13 reporting, lifted by AI-related technology stocks, while the median stock in the index was up less than 5%. Reuters That gap defines the tape. Cap weight is doing the work. The constituent experience trails the headline.
The skew is concentrated on a contribution basis. The technology sector accounted for more than 10 percentage points of the 14% year-to-date gain, and more than 200 constituents were lower on the year, according to Oct. 12 analysis. Reuters Most of the advance comes from one sector. The balance of the index, in aggregate, nets to a small residual. Breadth is thin.
Single-session internals confirmed the split. On Oct. 6 reporting, the S&P 500 posted 23 new 52-week highs against 2 new lows, while the Nasdaq Composite posted 61 new highs against 182 new lows. Reuters Index-level highs coexisted with elevated new lows underneath, particularly across Nasdaq listings. That divergence separates large-cap capitalization-weighted performance from broader listing performance.
Directional momentum also paused at times. The S&P 500 and Nasdaq ended near unchanged in a Thursday session in 2026 as uncertainty around the Middle East lifted oil prices and Treasury yields. Reuters That report carries no publication date and sits apart from the October contribution data. It provides context on rate and commodity crosscurrents, not on the year-to-date attribution.
The broader context here is what narrow leadership does to index statistics. When a small cohort with large weights drives contribution, headline return, median return and the share of advancers can diverge sharply. Dispersion rises. Idiosyncratic risk falls for the cap-weighted benchmark in the short run because covariance within the leadership cohort dominates variance, while stock-picking risk rises for any portfolio that does not replicate that weight structure. Tracking error widens almost by definition.
In my view, practitioners should read this as a concentration regime rather than a broad beta regime. Contribution analysis matters more than price-level analysis. Factor exposure is effectively a sector and size bet even in a supposedly diversified large-cap allocation. Liquidity tends to cluster in the leaders, which flatters execution in the benchmark and masks fragility in the laggards. The Nasdaq new high-new low split is instructive on that point. A healthy advance-broadening cycle would show highs expanding across listings and lows compressing. The Oct. 6 print showed the opposite pattern across exchanges.
Looking at what this means for risk management, the relevant question is sensitivity to a rotation in leadership. With more than 10 points of return dependent on one sector, earnings revisions, multiple compression or a shift in AI capex expectations in that cohort transmit directly to benchmark-level performance. The buffer from other sectors is limited because their net contribution to date is small. Hedging through broad index puts leaves residual basis risk if the hedge payer owns the median rather than the mean. Conversely, equal-weight or completion exposures carry their own tracking risk while the narrow trend persists.
For active mandates, the arithmetic is unforgiving. Outperforming a benchmark driven by concentrated contribution requires either overweighting the same concentration, with the resulting crowding and drawdown correlation, or accepting sustained underperformance during the narrow phase in exchange for convexity if breadth normalizes. Neither posture is neutral. Position sizing, turnover discipline and explicit limits on active sector deviation become binding.