Oil Drops 5% After US-Iran Pause, but Markets Aren't Betting on Peace

Brent crude futures fell $6.20 per barrel, or about 5%, in early Asian trade on July 27, 2026, trading at $90.58 as of 0620 GMT after the United States and Iran paused military strikes against each other. Reuters. The Associated Press put the decline at 4% in its own reporting. AP via WGN Radio.
The US-Iran conflict that preceded the pause was approximately five months old, according to Bloomberg. Bloomberg. The State Department's 2024 Country Reports on Terrorism, published in June 2026, documented that Iran-backed proxies killed three US soldiers and injured 47 in January 2024, tracing the escalation path that culminated in direct US-Iran military exchanges. US State Department.
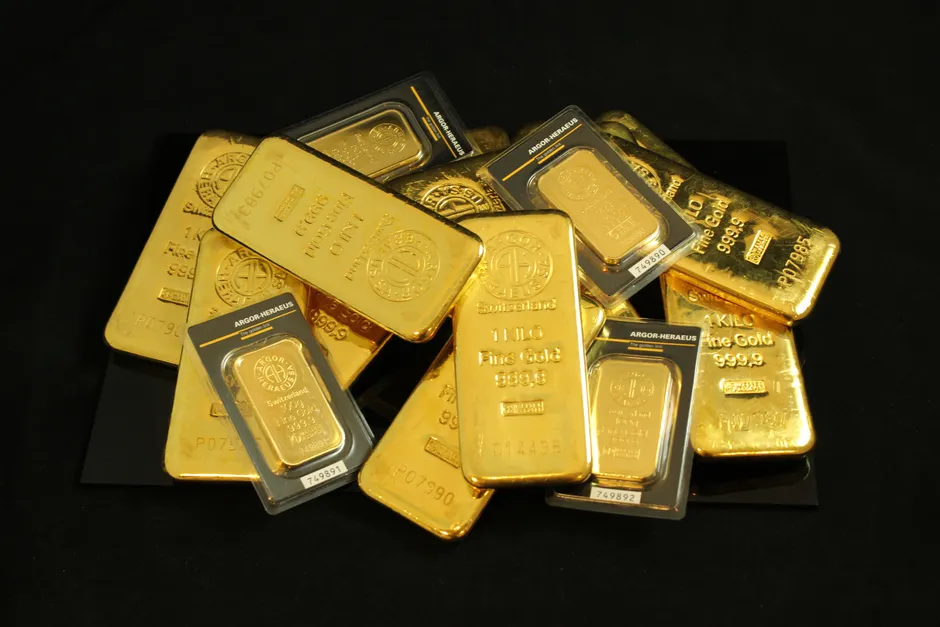
The pause triggered a broad relief rally across markets. US stock futures rose in early trading, attributed to the temporary lull in Middle East hostilities and the steep pullback in energy prices. Benzinga. Bonds rallied alongside equities on July 26. Bloomberg. Gold prices also gained in the same session, an unusual co-movement that typically signals investors unwinding positions as market volatility drops, rather than expressing a clear conviction about whether risk assets are headed up or down.
Chicago soybean oil futures fell the most in a month on July 27, with the decline attributed to the US halting strikes on Iran easing fears of further escalation. Bloomberg. Soybean oil is used as a biofuel feedstock, meaning its price is sensitive to crude oil dynamics. The synchronized move confirms that energy linkages, not agricultural supply and demand, drove the contract lower.
For context, Fitch Ratings projected an average Brent crude price of $87 per barrel for 2026 in a June 8 assessment, with an expectation that prices would ease after July if the Strait of Hormuz reopens. ANI News. Brent at $90.58 remains above that full-year average projection.
The broader context here is what this pause means for the real economy. A $6.20 single-session drop in Brent feeds quickly into wholesale gasoline and diesel pricing, with retail fuel prices typically lagging crude moves by one to three weeks. For consumers and transportation-intensive businesses, that passthrough could matter at the margin for headline CPI, the consumer price index measure that tracks changes in the cost of a basket of goods and services, in the August and September prints, depending on whether the pause holds.
The bond rally aligns with this disinflationary impulse. If sustained, lower energy costs feed directly into breakeven inflation expectations, the market's implied forecast for future inflation derived from the gap between regular Treasury yields and inflation-protected Treasury yields. Those expectations in turn influence nominal yields, the stated interest rates on bonds. The concurrent gold strength, however, is harder to reconcile with a pure disinflation narrative and may reflect safe-haven demand from participants uncertain whether the pause is a genuine de-escalation or a tactical regrouping.
The gold-bond divergence is worth watching. In a clean disinflationary rally, gold typically underperforms as real yields, which are nominal yields minus expected inflation, rise. Its participation here suggests either significant residual tail-risk hedging, meaning investors are protecting against low-probability but high-impact outcomes, or flow-driven dynamics from position unwinds in the crude market. The five-month duration of the conflict, combined with documented proxy activity predating direct exchanges, gives market participants ample reason to price resumption risk into the term structure, the pattern of prices across different contract expiration dates, rather than treat this as a durable ceasefire.
Reuters' July 27 commentary framed the crude market as pricing "adaptability, not hopeful Iran peace," which aligns with the curve structure: front-month volatility compressing while longer-dated contracts maintain elevated risk premia. Reuters. The soybean oil move reinforces this read; participants are de-risking correlated energy-beta positions, meaning investments that tend to move in tandem with energy prices, rather than making directional agricultural bets.
The Fitch $87 average assumes Hormuz normalization. Brent trading above that level after a 5% single-session decline implies the market is not yet pricing full Strait access, or is demanding a risk premium for resumption. The distinction matters: a genuine de-escalation with verified Hormuz throughput would likely see Brent test levels below the Fitch average, while a fragile pause keeps the geopolitical bid intact.
The cross-asset footprint is consistent with a volatility event, not a regime change. Equity futures, bonds, and gold all rallying simultaneously while oil and its biofuel proxies sell off is the textbook signature of a geopolitical risk premium being unwound. Whether it becomes more than that depends entirely on the operational reality of the pause.