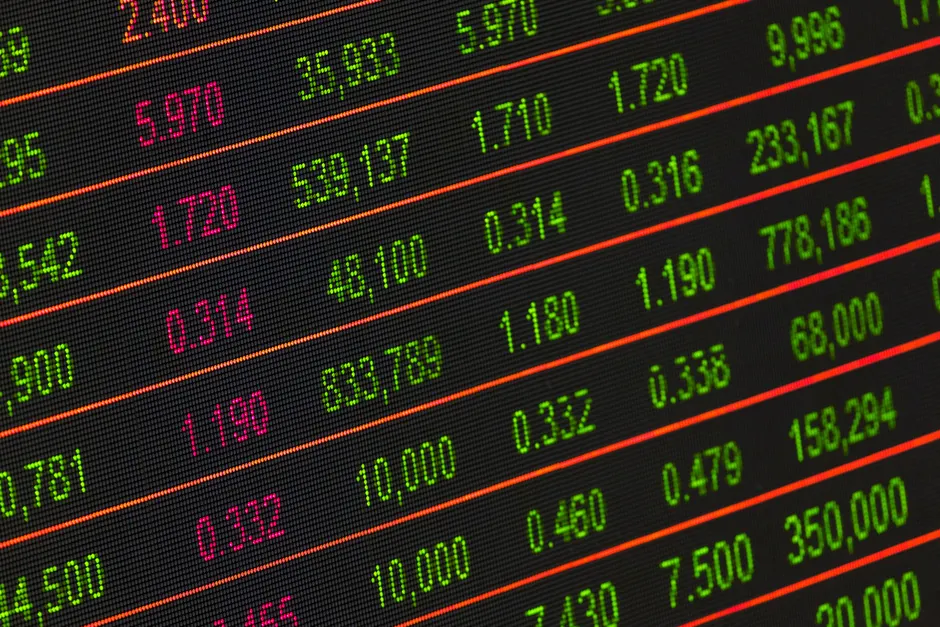
Gold Slides 3% to $3,998.52 as Brent Jumps 9.6%, Long Yields Rise
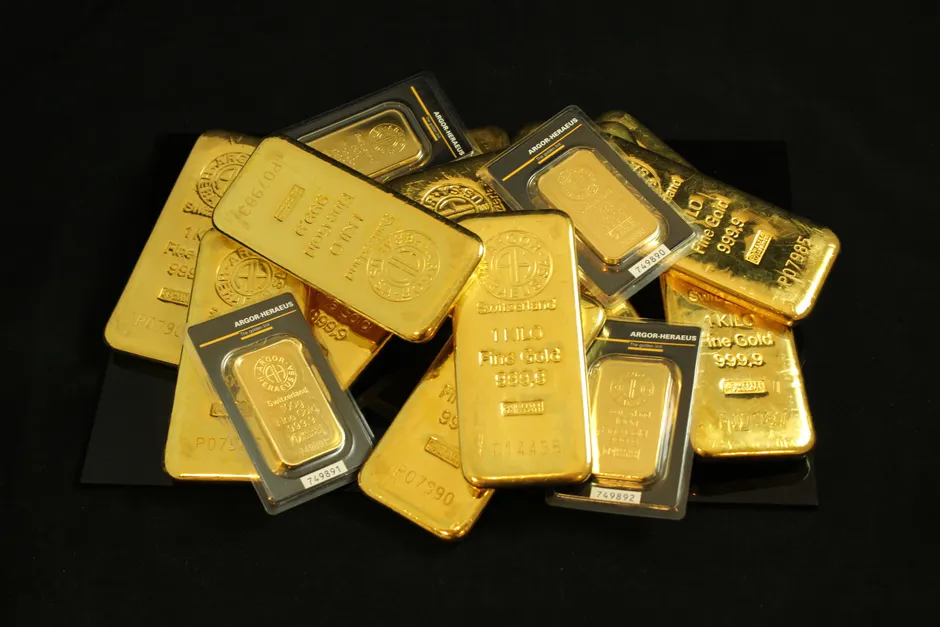
Spot gold fell 3% to $3,998.52 an ounce on July 13, 2026, dropping back below the $4,000 threshold as Brent crude settled at $83.30 a barrel, up $7.29, or 9.6%, on the session Reuters. The 30-year U.S. Treasury yield rose 3.31 basis points the same day, extending a move that has been building for months Reuters.
The combination is the kind cross-asset desks flag immediately: a risk-off metal down sharply, a geopolitical-risk-sensitive commodity up sharply, and long-end yields higher rather than lower. That is not the classic flight-to-safety print. It looks more like a shock to the energy complex bleeding into inflation expectations at the long end, with gold caught between its role as an inflation hedge and its role as a funding-cost-sensitive asset that suffers when real yields back up.
Context matters here because gold's 2026 trajectory has been unusually volatile even by its own recent standards. U.S. gold futures for June delivery had settled 1% lower at $4,511.20 back on May 19 Reuters, meaning spot has now given back roughly 11% from that level in under two months. Go back further and the swings look even sharper: AP News reported gold topping $4,300 during a single week in October 2025, with futures near $4,268 an ounce and a 6.7% weekly gain, part of a run that left gold up nearly 60% since the start of 2025 AP News. Measured against that October print, the $3,998.52 level is a retracement of roughly 6%, and against the near-60% annual run it is a reminder that a multi-month uptrend does not preclude a sharp single-session drawdown.
The rate backdrop helps explain why gold has struggled to hold its highs even as the long-run inflation narrative that drove the 2025 rally has not disappeared. The Federal Reserve cut its policy rate by a quarter point in late October 2025, taking it to roughly 3.9% from about 4.1% AP News, a cut consistent with the softer CPI print in February 2026 that had already spurred bigger market bets on further easing Bloomberg. But the long end has not cooperated with the easing narrative at the front end. Bloomberg reported on May 18 that U.S. long bond yields climbed four basis points to 5.16% during Asian trading hours, the highest level since 2023, on inflation concern Bloomberg. That divergence — Fed cutting the policy rate while 30-year yields grind toward multi-year highs — is a term-premium story as much as a growth or inflation story, and it has been building since at least January, when Bloomberg reported Japan's long-maturity government bonds falling on persistent fiscal and inflation concerns Bloomberg. Japanese long-end weakness has a way of exporting itself into global duration markets given the JGB market's role as a marginal price-setter for term premium globally, and the correlation between the January JGB move and May's 5.16% print on U.S. 30-years is difficult to dismiss as coincidence even without a direct causal claim.
What ties the oil move to the bond and gold moves on July 13 is less clear from the available reporting, and that is worth being honest about. A 9.6% one-day jump in Brent is large enough to be either a supply shock or a demand-repricing event, and either channel could plausibly push breakevens and nominal long yields higher simultaneously while pressuring gold if the move is read as dollar-supportive or as reducing the odds of near-term Fed easing. Reuters did not attribute a specific catalyst in the cited report, so any causal chain from the oil spike to the yield and gold moves should be treated as a plausible read rather than a confirmed one.
For desks running real-asset or inflation-hedge books, the practical read is that gold's inverse correlation with real yields has been reasserting itself even as the metal's multi-year uptrend remains structurally intact on a year-over-year basis. The bond market's message is more unsettled: a Fed cutting cycle sitting alongside a 30-year yield near cycle highs points to term premium repricing that has more to do with fiscal supply and inflation persistence than with the policy rate path itself. That combination — easing at the front end, hardening at the back end — is the one curve-steepening trades are typically built around, though nothing in the July 13 data confirms that trade has been put on at scale.