Stocks Are Slipping, Oil Is Climbing, and Borrowing Costs Are Up — Here's What's Going On

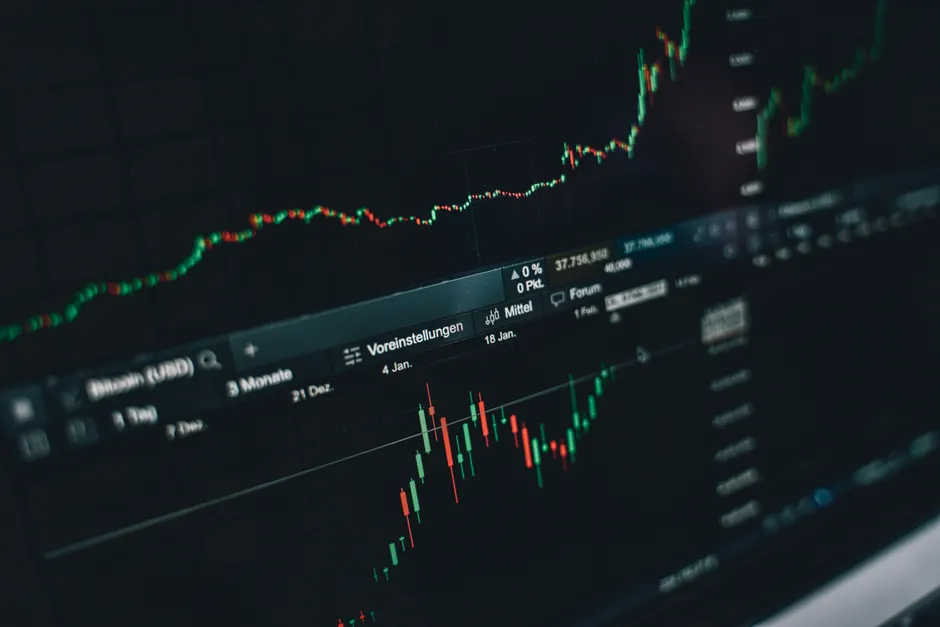
The S&P 500 — a basket of 500 large U.S. companies that people use as a yardstick for the stock market — has dropped below a key level that traders watch to gauge whether the trend is up or down. MarketWatch calls this a technical "triple threat" for stocks, and Forex.com says it's the biggest test for the market's recent rally this summer. MarketWatch
That key level is called the 50-day moving average. Think of it as a rolling line that tracks the average closing price of the S&P 500 over the last 50 trading days. When the index stays above it, the short-term trend is considered healthy. When it falls below, momentum has shifted from upbeat to shaky. Buyers who stepped in whenever the market dipped had been counting on that line to hold. It didn't. Forex.com's July 26 analysis says the current zone is a make-or-break point: hold here and the summer rally survives; fail and prices could fall further toward the next major level, the 200-day moving average. Forex.com
This is all happening while oil prices and interest rates are both up. On July 22, the Dow Jones Industrial Average — another major stock index — dropped 500 points in a single day while Brent crude oil surged above $100 per barrel. The 10-year U.S. Treasury yield, a benchmark interest rate that influences mortgages and loans, held flat at 4.661% that day, according to CNBC. CNBC
That rate has climbed noticeably since the spring. On March 11, the 10-year yield was at 4.207%, per the Wall Street Journal. Now it's near 4.66% — a rise of about 45 basis points. A basis point is simply one one-hundredth of a percentage point, so 45 of them equals 0.45 percentage points. That may sound small, but when the benchmark rate goes up, it raises the cost of borrowing across the economy and makes future company profits worth less in today's dollars. That tends to hurt growth-focused stocks the most. Wall Street Journal
Oil is making things harder too. WTI crude — a U.S. benchmark — was priced at $90.47 on July 24, according to MarketWatch's data page. Brent, the international benchmark, had already crossed the $100 mark two days earlier. When oil gets more expensive, it pushes up inflation expectations, which in turn keeps interest rates elevated and puts pressure on stock prices. MarketWatch
The MarketWatch report also mentions "places investors can hide," though the specific picks aren't detailed in the verified reporting. The general idea when oil rises and rates climb is to shift toward sectors that are less sensitive to interest rates or that benefit from higher energy prices. But the article's specific recommendations would need to be consulted directly before acting on them.
MarketWatch's "triple threat" refers to three separate technical warning signs all flashing caution at once. The exact three aren't spelled out in the verified reporting, but the practical point is that multiple signals are pointing the same direction — down — rather than giving mixed messages. That makes it less likely this is a routine dip and more likely it could be the start of a deeper decline.
The levels to watch are straightforward. The support zone Forex.com identified is the line in the sand for the summer trend. Below it, the 200-day moving average is the next major floor. The gap between the two will determine whether any pullback is controlled or messy. On the economic side, the 10-year yield staying above 4.60% while oil remains in the $90–$100 range keeps the pressure on. A turnaround in either of those would do more to steady the market than any chart signal.
In my view, what's still unclear is whether the stock market's technical breakdown is leading the news or merely reflecting it. The yield rise from 4.207% in March to 4.661% in late July, combined with oil pushing toward triple digits, is a real tightening of financial conditions. The S&P's drop below its 50-day average may simply be the charts catching up to that reality.