July 2026 CPI Came In Soft at 0.1% — What It Means for Rates, Gold, and Your Money
The U.S. Bureau of Labor Statistics reported on August 12, 2026 that the Consumer Price Index for All Urban Consumers (CPI-U) rose 0.1 percent on a seasonally adjusted basis in July, a sharp slowdown from June's 0.4 percent decline. The all-items index increased 3.4 percent for the 12 months ending July 2026, down from 3.5 percent for the 12 months ending June (BLS).
"Seasonally adjusted" means the figures have been smoothed to strip out predictable patterns — like higher heating costs in winter — so you can see the underlying price change. The year-over-year number, 3.4 percent, is the one the Federal Reserve watches most closely when deciding whether to raise, lower, or hold interest rates.
Shelter costs rose in July, pushing the monthly headline number into positive territory even as the broader index stayed subdued (BLS). Shelter — rent and owners' equivalent rent — is the main reason monthly inflation didn't go negative again. For Fed officials, that stickiness in housing costs matters because it suggests underlying inflation in the services side of the economy isn't fading as fast as the headline number might imply.
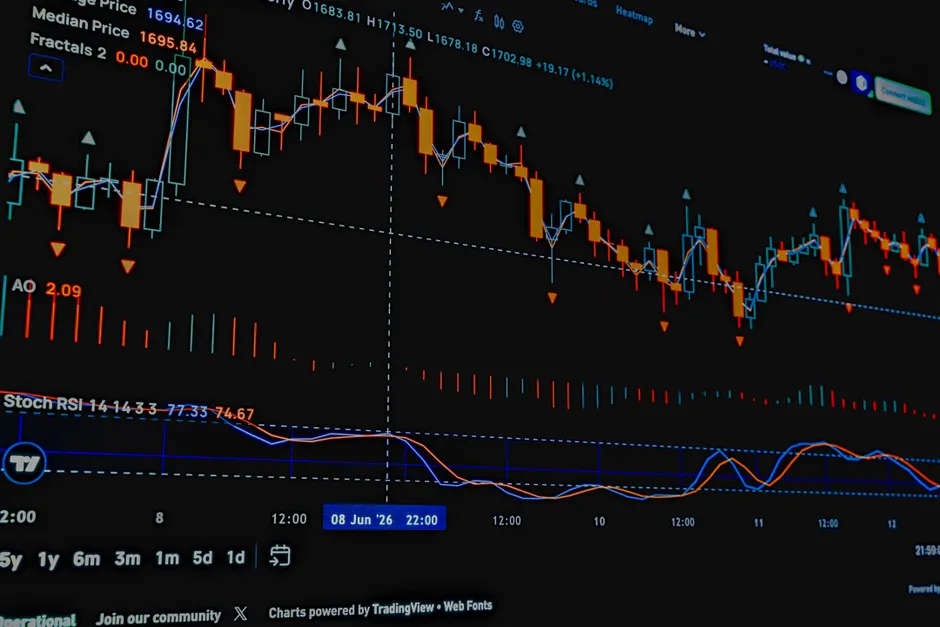
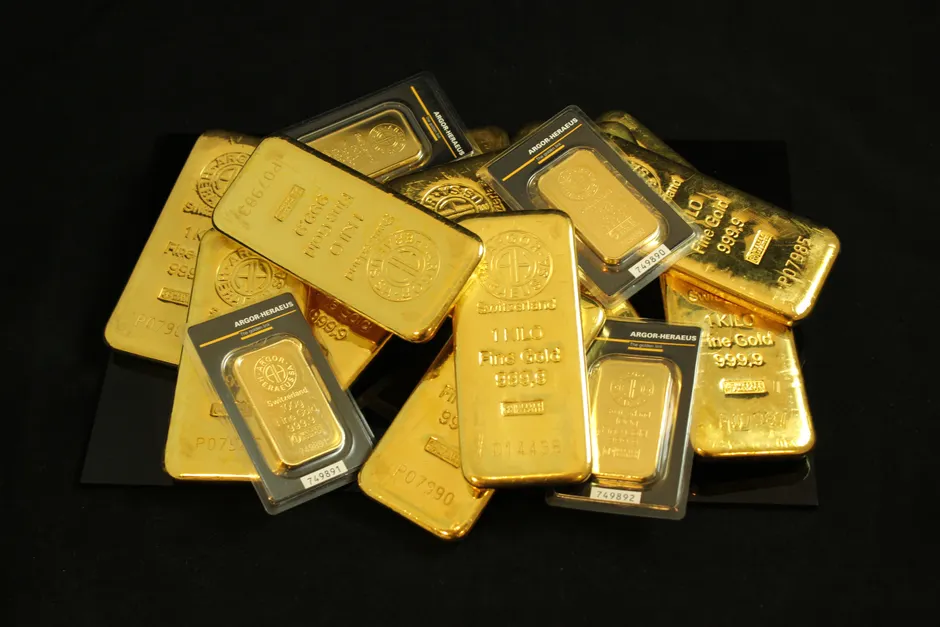
Gold's reaction was immediate. Spot gold rose 0.9 percent to $4,406.64 per ounce by 1:30 p.m. EDT on August 12, climbing above its 100-day moving average as the softer inflation data dampened market expectations for further rate hikes (Reuters). A 100-day moving average is a technical indicator that tracks the average price over the last 100 trading days; crossing above it is often read as a bullish signal by traders. The prior session told a different story: gold spot had fallen 0.3 percent to $4,376.31 by 1:50 p.m. EDT on August 11 as markets braced for the release (Energy News).
To grasp how much the July CPI release shifted expectations, consider gold's path over the past two months. In late June, spot gold dropped 0.2 percent to $4,008.94 an ounce, with prices down 11.3 percent on the month and gold set for its worst quarterly loss in 13 years on a hawkish — that is, inflation-fighting, rate-raising — Fed stance. U.S. gold futures for August delivery dipped 0.4 percent to $4,022.70 the same session (CNBC). The swing from sub-$4,010 spot in late June to above $4,400 on August 12 tells you how much the July CPI number changed the market's mind about where rates are headed.
For bond traders and rates desks, the year-over-year deceleration from 3.5 to 3.4 percent is incremental rather than transformative. The series has not broken below 3 percent, and shelter's continued contribution to monthly increases means the supercore services component — a measure that strips out food, energy, and housing to reveal deeper inflation trends — remains sticky. The data is consistent with a disinflationary trajectory that has lost momentum, not one that is speeding up. Fed Chair Jerome Powell's committee has cover to pause, but the year-over-year figure still sits above the 2 percent target by a meaningful margin.
The next CPI release is scheduled for Friday, September 11, 2026, at 8:30 a.m. ET, covering the August 2026 reporting period (BLS). That release will be the final CPI print before the Federal Open Market Committee's September 16-17 meeting, assuming the standard schedule holds, making it a critical input for any September rate decision.
The broader context here is that one soft month doesn't reverse a trend. The disinflation that began in mid-2026 is intact but slow. Borrowers hoping for rate cuts shouldn't bet on a pivot from a single number — the year-over-year figure at 3.4 percent remains elevated by historical standards. For those holding gold or gold-linked assets, the reclaim of the 100-day moving average is technically meaningful, but the metal's volatility over the past quarter — an 11.3 percent monthly drawdown in June followed by a sharp August rebound — tells you this move is being driven by shifting Fed expectations, not by durable demand fundamentals.