U.S. Inflation Drops Sharply in June—Here's What Markets Priced In
The Bureau of Labor Statistics reported on July 14, 2026 that the seasonally adjusted Consumer Price Index for All Urban Consumers fell 0.4 percent in June, reversing May's 0.5 percent gain. The annual inflation rate decelerated to 3.5 percent for the 12 months through June, down from 4.2 percent in the prior month—a swing of 0.7 percentage points, which is outsized by CPI standards, where month-to-month shifts of 0.1 points are typical.
Reuters attributed the softness largely to abating energy prices, and noted the print came in cooler than analysts had predicted. Energy components likely did disproportionate work in driving the deceleration. Base-effect arithmetic—the statistical phenomenon of comparing June 2026 against a milder June 2025—amplified the impression of cooling inflation, though the full breakdown by category was not released.
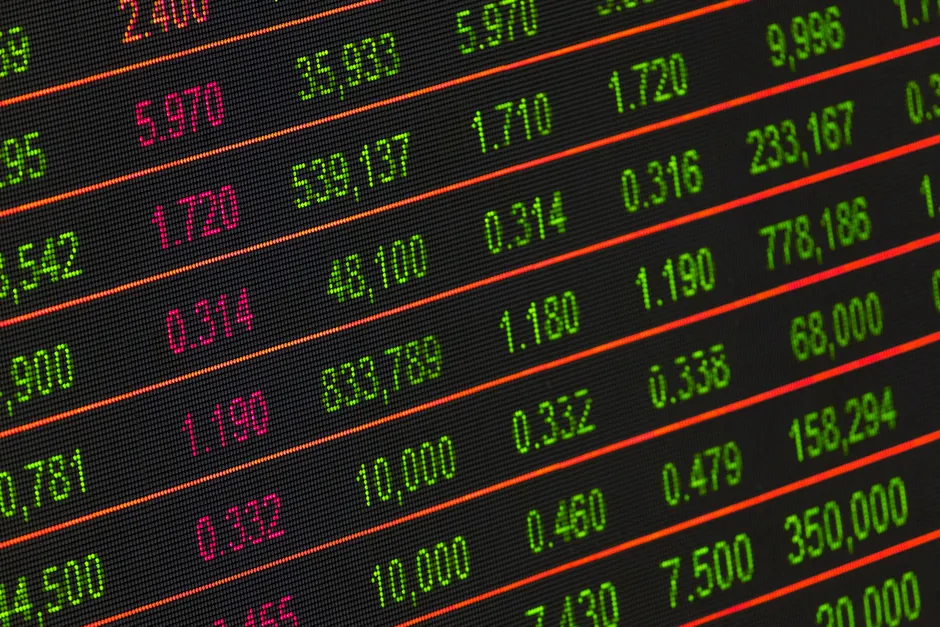
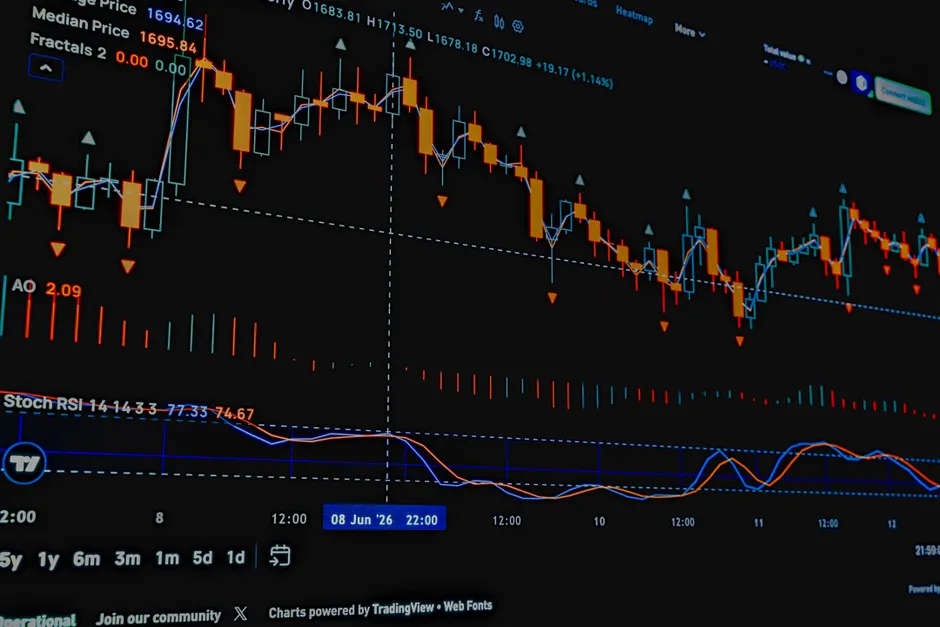
Equity markets responded immediately. The S&P 500 closed 0.38 percent higher on July 14, with the Nasdaq also in positive territory. The rally extended into the following day: Nasdaq futures rose 0.8 percent on July 15 as global stocks advanced on the back of the U.S. inflation drop. The Toronto Stock Exchange also ended higher on July 14 in response to the U.S. data.
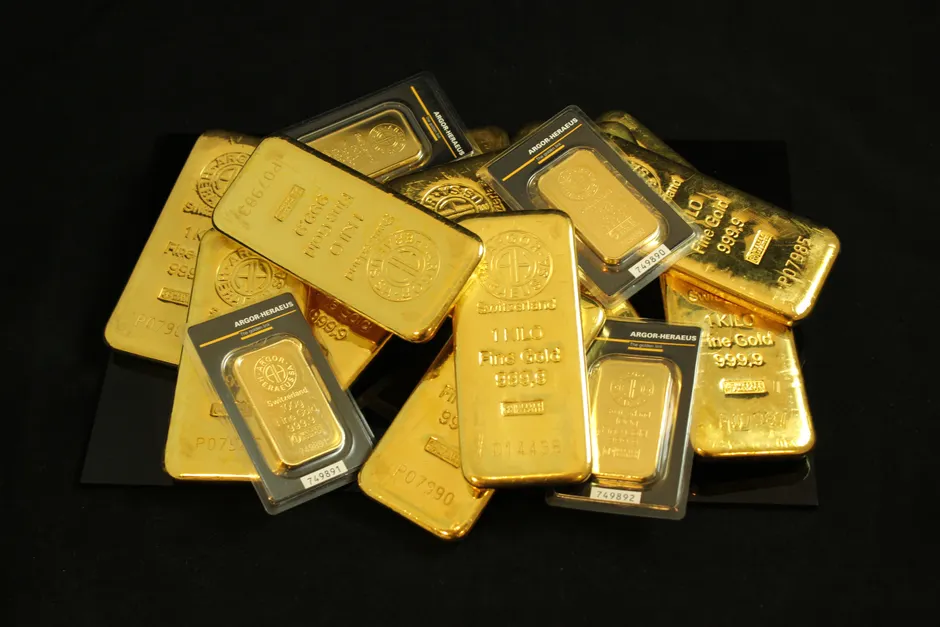
Fixed-income markets and gold told a coherent story. Traders wound back expectations for Federal Reserve rate hikes following the release. Two-year Treasury yields—the maturity most sensitive to near-term Fed policy expectations—declined on July 15 as that repricing worked through the curve. Gold, which benefits both from lower real yields and from any softening in the dollar's interest-rate advantage, settled 1.6 percent higher at $4,069.70 on July 14, having gained more than 2 percent during the trading day.
Not every market interpreted the data identically. European index futures slipped 0.2 percent and FTSE futures fell 0.3 percent on July 15; Reuters attributed these moves to a broader mix of factors rather than the inflation print alone. Ongoing U.S.–Iran tensions also weighed on sentiment in parallel with the inflation-driven optimism, a reminder that equity and futures rallies were not the only variable at work across trading desks.
What matters here is what "traders paring back rate-hike expectations" actually signals about the market's prior assumptions. Repricing away from additional rate hikes—rather than toward cuts—suggests the baseline view had already embedded some tightening risk, plausibly tied to the run of stronger prints that produced the 4.2 percent May reading. That June's data unwound a chunk of that concern in a single release is the kind of one-month discontinuity that often gets revisited once the BLS applies seasonal adjustments and revisions in subsequent reports.
For rates traders, the immediate focus is the front end of the curve. Two-year yields falling on reduced hike probability is straightforward mechanically, but whether that move sticks depends on whether the energy-driven disinflation shows up as a one-off relative-price shift or bleeds into core inflation measures in the prints ahead. That distinction isn't resolved yet, since the core CPI figure—inflation excluding volatile food and energy—wasn't included in this release. Traders pricing interest-rate derivatives off a single monthly print flagged as energy-driven are running a real risk: if July or August data reverse course, their positioning could unwind quickly.
The gold move is consistent with a real-yield story—the idea that lower expected inflation reduces the eroding effect on returns from safe assets—though separating that from pure dollar weakness isn't possible without concurrent currency data. What is clear is that equities, rates, and gold all moved in the same direction on July 14–15: all three asset classes reacted as though near-term tightening risk had fallen. That directional coherence lends some confidence that the market genuinely read the print as dovish rather than noisy.