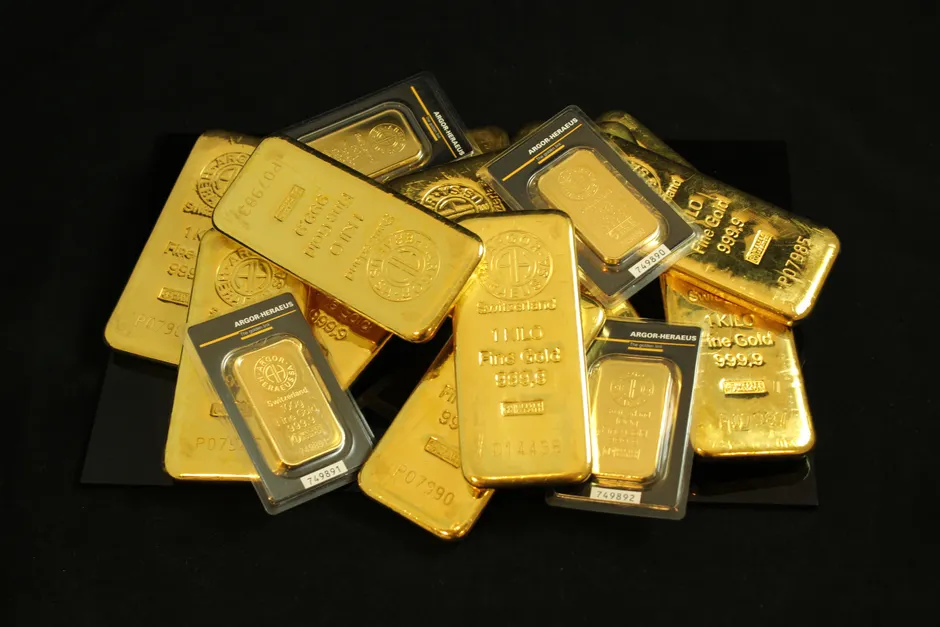
Gold Pulls Back After Inflation-Fueled Rally to Two-Month High

Spot gold fell 1.2% to $4,354.58 per ounce by 12:58 a.m. EDT on August 13, 2026, after trading as high as $4,420.40 earlier in the session. Investors locked in gains following a climb to two-month highs, driven by softer US inflation data released the prior day. Reuters
The retreat caps a volatile month for gold. The current leg up began on July 14, when prices gained more than 2% after softer-than-expected US CPI (Consumer Price Index) data raised hopes that the Federal Reserve would ease off on interest rate hikes. The next day, July 15, gold pared early losses after the Producer Price Index — a measure of wholesale inflation — also came in lower than expected, easing concerns about the Fed's rate path. Reuters Reuters
The August rally unfolded in stages. On August 10, spot gold rose 0.8% to $4,376.56 per ounce by 2:45 p.m. EDT, with US gold futures adding about 0.5% to settle at $4,419.70. On August 11, spot gold was down 0.3% at $4,376.31 per ounce at 1:50 p.m. EDT, after reaching $4,434.84 earlier — its highest level since June 5. On August 12, spot gold rose 0.9% to $4,406.64 per ounce by 1:30 p.m. EDT and climbed above its 100-day moving average (a technical indicator that smooths out daily price swings to show the broader trend), as US inflation data dampened rate-hike bets. Reuters Reuters Reuters
The August 13 selloff coincided with the US Bureau of Labor Statistics releasing the Producer Price Index for July 2026. The BLS has scheduled the August PPI release for September 10, 2026, at 8:30 a.m. Eastern Time, with subsequent prints for September and October 2026 slated for October 15 and November 13, respectively. BLS BLS
The broader context here is a market finely tuned to the relationship between inflation and real yields. Real yields are bond returns after subtracting inflation — when they rise, gold tends to suffer because gold pays no interest, making yield-bearing assets more attractive by comparison. Gold's rally above the 100-day moving average on August 12 confirmed technical strength that was partially surrendered the next day, with spot prices giving back roughly $66 per ounce from the session high. The pattern is consistent with what OCBC identified in early July when it cut its gold and silver forecasts, citing higher real yields. At that time, OCBC projected gold to average $4,180 per ounce by September 2026 before recovering gradually to $4,820 per ounce by September 2027. Yahoo Finance
That July revision was a notable pullback from the bank's January position, when OCBC had raised its gold price target to $5,600 per ounce by end-2026, up from $4,800 per ounce, citing haven demand. Investing.com
The trajectory of those revisions tells a story. OCBC's January hike to $5,600 reflected a haven-demand thesis — the idea that investors flock to gold in uncertain times. By July, higher real yields had displaced that framing enough to warrant a cut, even as spot prices in August traded well above the bank's September target of $4,180. The gap between OCBC's near-term forecast and the actual spot price above $4,350 on August 13 suggests either the real-yield headwind has moderated since the July call, or the market is pricing in a more dovish (less aggressive) Fed trajectory than the bank's models assume.
For traders positioning around the next PPI print on September 10, the key tension is whether the July PPI data released August 13 sustained the disinflationary trend that fueled the rally, or whether the gain-locking on August 13 reflects skepticism that the Fed will validate the dovish pricing embedded in the two-month high. The 100-day moving average, which gold reclaimed on August 12, will be a technical level to watch: a sustained break above $4,400 would signal continuation, while failure to hold could open a test of the $4,376 level that capped prices on August 10 and 11.
In my view, the macro pivot point remains real yields and the Fed's response function. Each inflation print is now a binary event for gold positioning, and the volatility cycle around CPI and PPI releases — compressing between data drops and expanding around them — is creating opportunities for tactical participants and whipsaw risks for those running directional exposure through the data.