Gold's $600 Rebound: What Drove the Recovery and What Forecasts Get Wrong
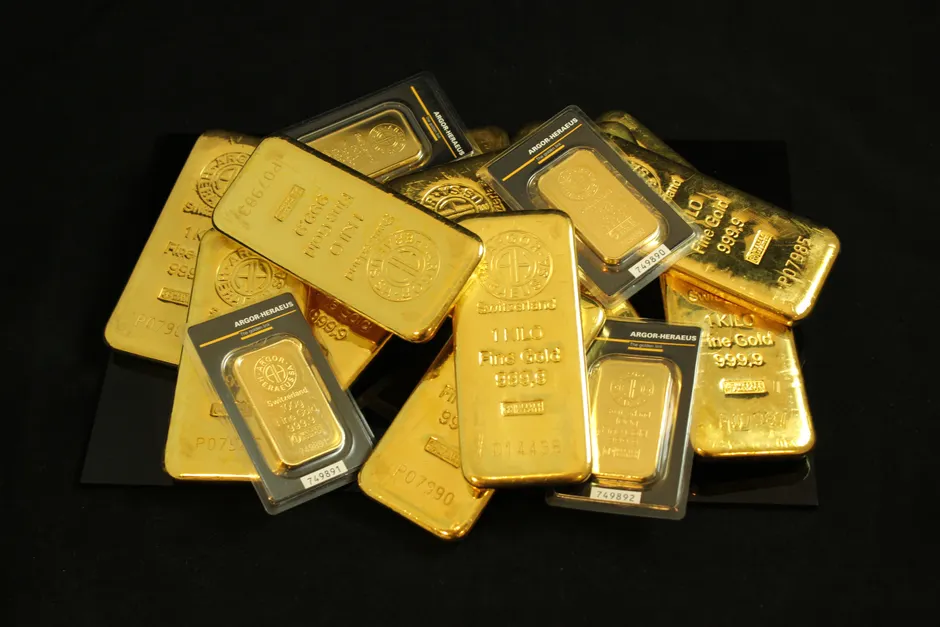
Gold has climbed from around $4,000 per ounce in mid-July 2026 to roughly $4,600, returning to levels last seen in May, after a swing of approximately 12% from its year-to-date low (ING). Spot gold was trading near $4,400 an ounce as of late August, with the rebound driven by expectations that central banks will hold benchmark rates frozen and a deteriorating outlook for further rate hikes (Business Times).
The trough was brief but steep. Kitco reported gold at $3,987.90 an ounce on July 16, down nearly 2% on the day, with Bank of America suggesting clients buy the dip and average down — that is, gradually adding to a position at lower prices to reduce the average cost per unit (Kitco). By July 24, gold was trading near $4,068, caught between two technical trendlines with support — the price level where buyers tend to step in — near $3,800 (Kitco). The recovery then accelerated into August: spot gold rose 0.8% to $4,086.36 per ounce by 2:20 p.m. EDT on August 4, while U.S. gold futures settled 1.5% higher at $4,152.60 (Reuters). A CPM Group trade signal published by Kitco on August 7 reported gold at $4,399 as of 12:24 p.m., having broken its downward trend line, with a range target of $4,600 and an initial timeframe entry near $4,280 (Kitco).
ING attributes the rebound to two forces: renewed investment demand and growing unease over the U.S. fiscal outlook (ING). The interest-rate channel is equally clear. Market pricing shifted toward a freeze in the benchmark interest rate in August, with the probability of a rate hike diminishing, which directly supports non-yielding assets like gold — assets that do not pay interest or dividends, making them more attractive when rates are flat or falling (Maeil Business). Gold's sensitivity to real rates — interest rates adjusted for inflation — remains the dominant mechanism at work here: when the expected path of policy rates flattens or pivots lower, the opportunity cost of holding bullion falls, and investors adjust their positions accordingly.
The longer-run structural bid for gold also persists. ING notes that gold staged a historic rally, doubling in less than two years, propelled by central bank buying as reserve managers diversify away from the U.S. dollar (ING). That structural demand layer, rooted in de-dollarization rather than speculative trading flows, provides a price floor that operates independently of where interest rates are headed.
The dispersion in sell-side forecasts is wide and tells its own story about the range of plausible scenarios. Bank of America cut its 2026 average gold forecast by 14% to $4,360 an ounce, citing a more hawkish — or rate-hike-friendly — Federal Reserve (Reuters). Morgan Stanley targeted $4,500 per ounce by mid-2026 (Reuters). Deutsche Bank raised its 2026 forecast to $4,000 per ounce, citing demand and Fed policy (Reuters). ING's Commodities Outlook 2026 expected gold to remain strong and reach new heights on the back of anticipated Fed rate cuts and a pressured dollar (ING), having earlier projected a $4,000/oz Q4 average (ING).
At the bullish end of the spectrum, J.P. Morgan Global Research expected gold prices to push to $6,000/oz, with its 2026 and 2027 outlooks both ahead of current spot levels (J.P. Morgan). A Reuters survey of 29 analysts and traders returned a median 2026 forecast of $4,509 per troy ounce (Reuters.
The spread between Bank of America's $4,360 average and J.P. Morgan's $6,000 target is not a rounding error. It reflects fundamentally different assumptions about the Fed's terminal rate — the level where policymakers stop adjusting — the durability of central bank gold accumulation, and whether fiscal concerns translate into sustained safe-haven demand or prove transitory. The Reuters median at $4,509 suggests the consensus leans closer to the cautious end, with the outliers pulling expectations in both directions.
For market participants, the actionable tension is between spot momentum and forecast dispersion. Gold has reclaimed $4,400 with a broken downtrend and a technical range target of $4,600 already flagged by CPM Group. Yet Bank of America's downgrade, dated July 8, was predicated on a more hawkish Fed, a thesis that subsequent rate-freeze expectations in August have at least partially undercut. The August repricing of the rate path, if it holds, undermines the core assumption behind the year's most prominent bearish forecast revision.
What remains unresolved is whether the rate-freeze expectation hardens into an actual cut cycle or stalls at a plateau. Central bank buying continues irrespective of the Fed's next move, but the marginal price-setting flows — the trades that actually move the price day to day — are still rate-sensitive. The gap between $4,400 spot and a $6,000 bull-case target is wide enough to punish directional conviction in either direction if the policy picture shifts again before year-end.