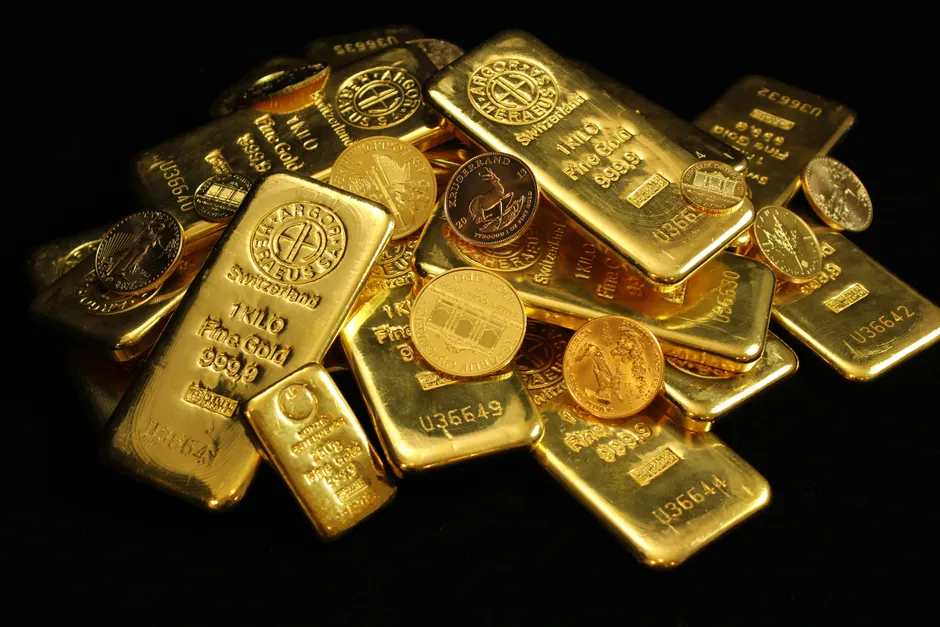
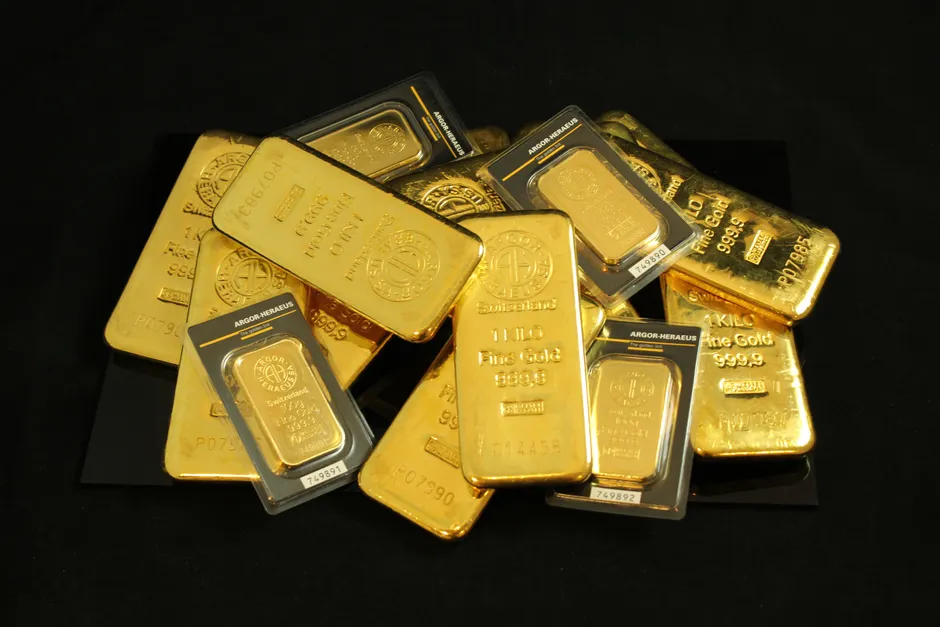
Gold's 5.5% Pullback: Why Hot Inflation Hit Prices
Gold prices fell more than 1% after strong U.S. inflation data and higher oil prices raised bets that the Federal Reserve would raise interest rates, according to a 10 September report. Reuters
That drop extended a run of inflation pressure on gold. Gold futures had already lost ground after August producer-price inflation picked up and raised expectations for a Fed rate increase the next week. Wall Street Journal Producer prices measure wholesale inflation before it reaches shoppers.
UBS framed the pullback in its 8 September wealth-management note titled "Daily: Look beyond rates to gold's long-term support". The bank said gold had fallen 5.5% after jumping 15% in the first three weeks of August. UBS A day earlier, UBS had said higher real interest rates, meaning rates after inflation, and a stronger U.S. dollar could be a short term drag on gold. UBS
Late August trading was driven by price data and Fed messaging. Gold futures settled lower after Federal Reserve Chairman Kevin Warsh raised concerns about underlying inflation. Wall Street Journal Gold had slipped in Asian trading as U.S. core inflation data, which strips out volatile food and energy prices, made a Fed increase in its benchmark rate look more likely. Wall Street Journal
That weakness came after a strong August rally. UBS, in a note titled "Daily: Diversify beyond the US dollar" published 25 August, said gold had risen about 15% that month. UBS Spot gold, the price for immediate delivery, was down 0.1% at $4,516.19 per ounce on 20 August after touching as low as $4,450.08. Reuters
Earlier in the summer the direction was different. Gold rose as the dollar weakened and inflation cooled, with traders cutting bets on rate hikes, according to a 30 July report. Reuters Prices had turned higher after a U.S. inflation reading came in mostly as expected, according to a 25 June report. Reuters
This kind of swing is not new this year. Gold futures settled down 9.5% on the week to $4,570.40 per troy ounce, the standard unit for precious metals, according to a 20 March report. Wall Street Journal That $482.10 weekly fall was the largest weekly dollar drop on record. Wall Street Journal Other undated reports put spot gold 0.1% lower in Asian trade at $4,483.97 an ounce and noted gold posted a third straight monthly decline in May.
The broader context here is a chain reaction familiar on trading desks. When inflation runs hot, bond yields, the return for lending to the government, tend to rise. If yields after inflation rise too and the dollar firms, holding gold costs more in missed interest because gold pays nothing. Futures prices react first. Buying of bars, coins and gold-backed funds tends to follow later.
In my view, the order of events matters more than any single report. A 15% jump in three weeks followed by a 5.5% fall points to crowded positioning, with many traders piled into the same bet, as much as to a change in rate expectations. That does not make the inflation data secondary. Wholesale and core readings reset expectations for short term rates, and gold repriced against that curve. It does mean the fast August rally left little buffer for news that favored higher rates.
Looking at what this means for risk management, it helps to separate level from momentum. The level reflects lasting demand for protection and for alternatives to the dollar. Momentum reflects short term bets on rates. When they pull in opposite directions, daily ranges widen and technical frictions can add to the move. The March 9.5% weekly drop and record dollar loss show how fast traders can exit when the outlook shifts.