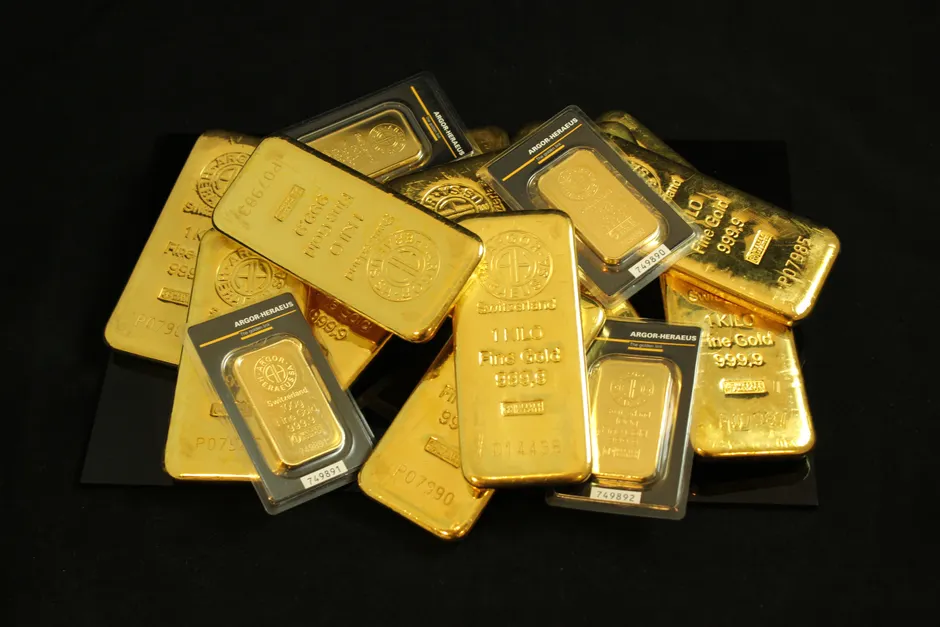
Gold's August 18 Drop: What Drove It and What It Means for the Metal's Wild 2026
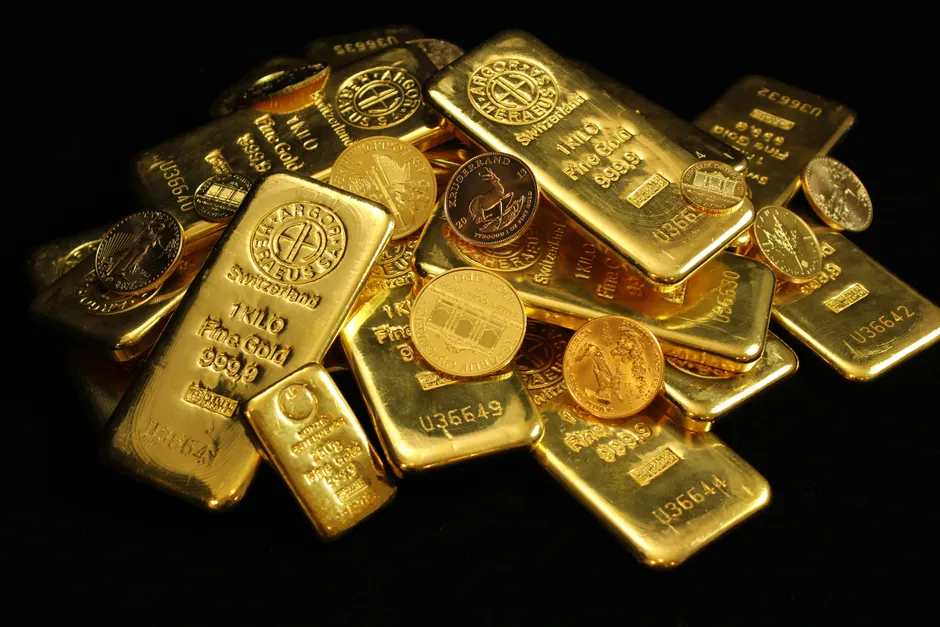
Gold fell to $4,334 per troy ounce on August 18, 2026, down 1.86% from the prior day, according to Trading Economics. The drop came one day after spot prices had risen 0.9% on a softer dollar and receding expectations of a Federal Reserve rate hike, as Reuters reported on August 17.
The whipsaw captures a metal that has been anything but calm in 2026. Over the referenced Trading Economics period, gold is up 8.13% and sits 30.65% higher year-on-year as of August 18. December gold futures (GC=F) opened at $4,400 per ounce on Monday, August 10, flat versus the prior Friday's close, marking the highest opening print since early June, per Yahoo Finance.
The rally into mid-August followed a bruising second quarter. On June 24, spot gold touched its lowest level since November 2025, with silver slipping below $60 per ounce, Reuters reported. By June 30, spot gold had recovered modestly to $4,027.03, up 0.3% on the session but still notching a fourth consecutive monthly decline amid persistent Fed rate-hike bets, per Reuters.
Further back, on April 13, spot gold was down 0.3% at $4,734.50, with markets pricing roughly a 29% probability of a Fed rate cut at the time, according to Reuters. The trajectory from April's highs through June's lows and back into August shows how the metal reacts to shifting rate-hike and rate-cut odds rather than to any single turning point in the broader economy.
CNBC reported in mid-August that gold's recent rally reflects renewed investor interest amid tamer inflation data and evolving Federal Reserve rate expectations. The August 17 gain Reuters described fits that thesis: a weaker dollar and diminishing rate-hike odds are the classic twin tailwinds for gold, which pays no interest or dividend to its holders.
The broader context here is a market caught between two competing forces. On one side, the year-on-year gain of 30.65% reflects structural demand and a fundamental repricing of dollar-denominated real rates (interest rates adjusted for inflation) over the past twelve months. On the other, the intrayear volatility — from $4,734 in April down below $4,000 territory in June and back above $4,300 by August — reflects a market where small changes in the Fed's expected interest-rate path are driving outsized swings in medium-term Treasury yields. The 1.86% single-day drop on August 18, immediately following a 0.9% gain, is the kind of two-day reversal that characterizes low-conviction positioning rather than a durable shift in trend.
J.P. Morgan Global Research analysts expect gold prices to push toward $6,000 per ounce across 2026 and 2027, per their published research. At the August 18 spot of $4,334, that target implies roughly 38% upside from current levels. Whether that thesis hinges on a continuation of the same real-rate compression (falling inflation-adjusted interest rates) that drove the year-on-year gain, or incorporates supply-side and central-bank accumulation factors not visible in the price action alone, the call is notably aggressive relative to current spot and deserves scrutiny on its underlying assumptions.
The mechanics worth tracking are straightforward. Gold tends to move inversely to the dollar index — when the dollar weakens, gold becomes cheaper for buyers holding other currencies, lifting demand — and it is also sensitive to real yields, which represent the return on bonds after accounting for inflation. When real yields fall, gold becomes more attractive by comparison because it narrows the opportunity cost of holding a non-yielding asset. The April data point, where gold traded at $4,734 with only a 29% implied probability of a cut, versus the August 17 rally on fading hike expectations, frames the range of outcomes the market is weighing. Every basis-point shift (one basis point equals 0.01 percentage point) in the expected Fed funds path translates into a repricing of that opportunity cost. Traders and allocators should be watching the next Fed communications for whether the rate-hike bets that pressured gold through June are genuinely fading or merely on pause.
What the verified data cannot resolve is whether the August rebound has legs. The year-on-year gain is real and large. The intrayear path is volatile. And the gap between $4,334 spot and a $6,000 target is wide enough that the call is a directional thesis, not a forecast with a tight confidence interval.