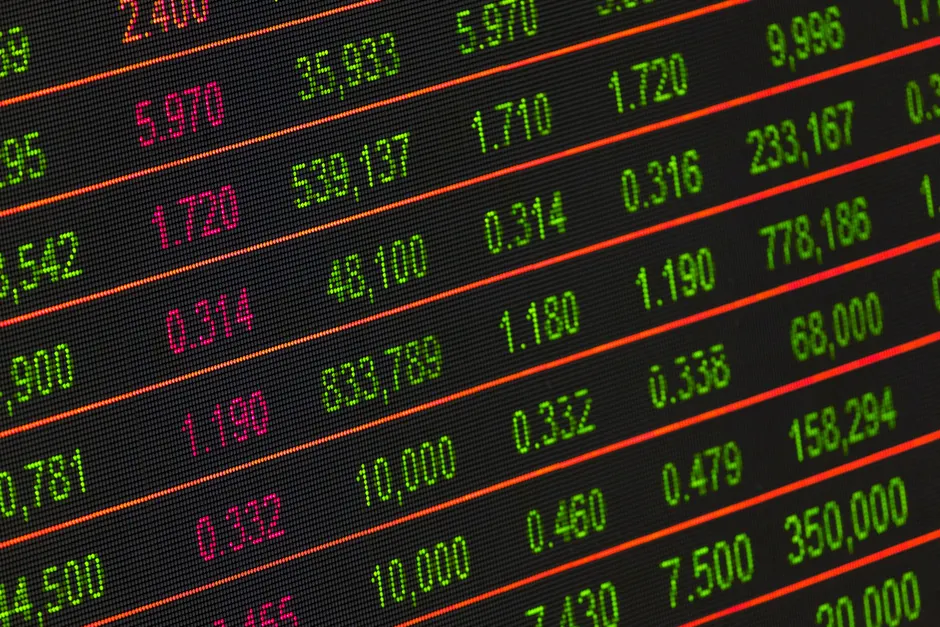
Bond Yields Rose Even as Oil Eased: What Changed on Sept. 29

Treasury yields pushed higher on Sept. 29, 2026, while oil prices ticked slightly lower that day.
A Treasury yield is the yearly return investors demand to lend money to the U.S. government. When it rises, other borrowing costs often follow. The move was flagged in Wall Street Journal live coverage under the card title 'Treasury Yields Reach New Milestone and Threaten Others,' headlined 'Treasury Yields Push Higher Despite Decline in Oil Prices.' The Journal did not in that card specify the milestone level. Yields rose while crude eased.
U.S. stocks fell as higher oil prices and Treasury yields weighed, with investors weighing uncertainty over prospects for an Iran war, according to Reuters video reporting published Sept. 29.
On Sept. 15, Wall Street ended lower as oil prices spiked and the benchmark Treasury yield broke above 5%, according to Reuters. In that session the Dow fell 0.63%, the S&P 500 fell 0.45% and the Nasdaq fell 0.78%. On Sept. 17, Wall Street ended higher as easing oil prices, falling Treasury yields and solid labor data supported markets, Reuters reported. On Sept. 23, Wall Street ended lower, pulled down by Alphabet and Amazon, as Treasury yields climbed, according to Reuters.
On Sept. 11, the benchmark 10-year Treasury yield was slightly higher at 4.96% while oil prices retreated, with gold up 0.8% to $4,350 an ounce, Reuters reported. On Sept. 3, the yield on the benchmark 10-year note fell 3.8 basis points to 4.756%, according to Reuters. A basis point is one-hundredth of a percentage point. That move coincided with comments from Federal Reserve official Waller, alongside falling bond yields and rising stocks.
The gap between the 10-year and 2-year Treasury yields was 0.25 percentage points on Sept. 22, 0.26 points on Sept. 23, 0.31 points on Sept. 24, 0.36 points on Sept. 25 and 0.32 points on Sept. 28, according to FRED. That gap measures the slope of the yield curve. A positive number means long-term lending pays more than short-term lending. FRED noted the series was updated Sept. 28 at 4:03 PM CDT, with the next release scheduled for Sept. 29.
The Federal Open Market Committee decided to "maintain the target range for the federal funds rate at 3-1/2 to 3-3/4 percent," according to the Federal Reserve statement published July 29. That rate is the overnight benchmark the Fed sets directly. At the July press conference, Federal Reserve Chairman Warsh said nominal and real yields were materially higher across the Treasury curve, according to the Federal Reserve transcript. Nominal means before adjusting for inflation. Real means after adjusting for inflation.
The broader context here is that Sept. 29 broke the template from Sept. 15 and Sept. 17. For most of the month, oil and yields moved together and squeezed equities through two channels at once, higher discount rates plus higher input costs. When yields rise into softer oil, the signal points more toward real rates, digestion of Treasury supply, or shifting views on growth and government issuance, rather than a simple inflation pass-through from crude. For savers and borrowers, that still matters because mortgages and corporate refinancing track the long end, while stock valuations use the same curve. A 10-year near or above 5% with a steeper 10s-2s spread changes carry, hedging costs and the appeal of cash. Mega-cap growth led the Sept. 23 decline when yields climbed.
In my view, the question for desks is whether the Sept. 29 decoupling lasts. A sustained rise in yields on softer oil would suggest the bond move is not being driven by near-term commodity inflation. That would leave policy expectations and term premium, the extra compensation for holding longer-term debt, as the residual to explain, with focus on long-duration equity exposure and curve slope.