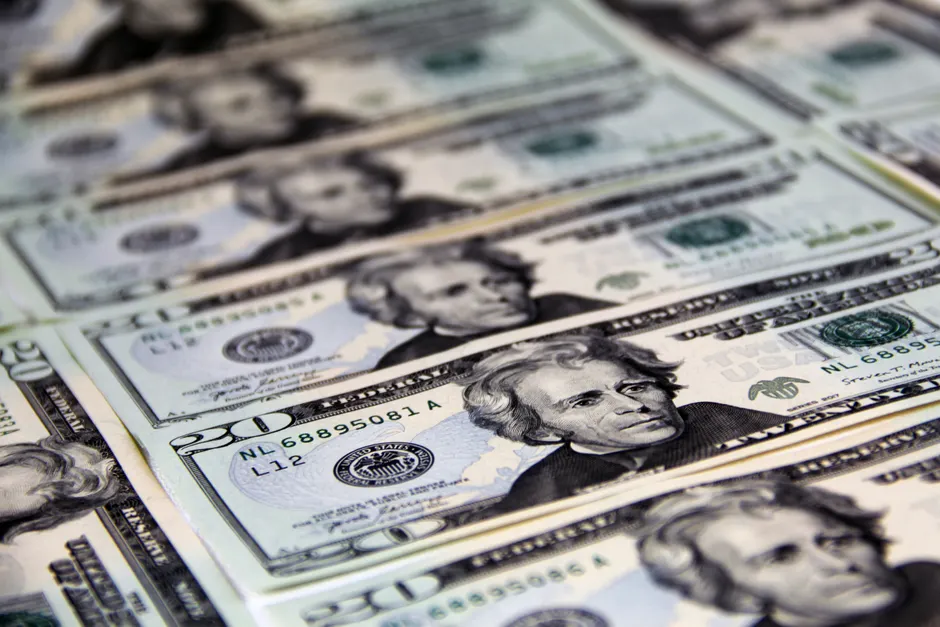
Asian Currencies Under Pressure as $100 Oil Meets a Strong Dollar

Investors stayed bearish on most emerging Asian currencies in a poll published on October 1, 2026, as high oil prices fuelled concerns. Reuters Bearish means polled investors expected further falls against the U.S. dollar.
Brent crude, the global benchmark for oil prices, reclaimed the $100-per-barrel mark around October 1, 2026. The Indian rupee ended down 0.5% at 96.3150 per U.S. dollar on October 1, 2026. Reuters
That move extended a stretch of dollar firmness. The WSJ Dollar Index, a broad gauge of the dollar against a basket of currencies, rose 0.11% to 96.96, as reported on September 30, 2026. The Singapore dollar weakened slightly against the U.S. dollar in the Asian session. The Wall Street Journal
Two days earlier, the pattern was the same. The U.S. dollar held near a two-month high while Asian currencies weakened. The yen slipped around 0.3% to 157.7 per U.S. dollar. Yahoo Finance
Japan's Finance Minister was Satsuki Katayama. The yen had reached a 40-year low of 163.98 per U.S. dollar before intervention, when authorities buy yen to support it. After intervention, the yen rose to as high as 155.21 per U.S. dollar. Reuters
That price action followed weeks of consolidation, when currencies traded in a narrow range. The Wall Street Journal reported on August 18, 2026 that Asian currencies consolidated against the dollar in early trade but may be weighed down by rising crude oil prices. The WSJ Dollar Index rose 0.10% to 96.07 at that time. The Wall Street Journal
The sequence from August to October is tight. Consolidation gave way to outright weakness. Index levels moved higher. Spot pairs, the current market exchange rates, moved with them.
The broader context here is a dual squeeze for net energy importers, countries that buy more oil than they sell. A stronger broad dollar raises the local-currency cost of dollar-priced imports. Higher crude adds a terms-of-trade drag, meaning more exports are needed to pay for the same oil. Forwards, contracts to exchange currency later, and cross-currency funding costs can amplify the move without any change in domestic policy rates. For households, that can feed into fuel and import prices.
In my view, the levels cited tell the positioning story better than the daily changes. A 0.5% fall in the rupee to 96.3150 and a 0.3% slip in the yen to 157.7 are orderly on their own. Placed beside a two-month high in the dollar, a $100 Brent print, and a bearish poll read across the region, they point to crowded one-way risk. That is when liquidity thins and intraday ranges widen.
Looking at what this means for market structure, intervention marks are now part of the near-term map. The swing from 163.98 to 155.21 defines the range traders will reference for yen. It does not cap the pair. It sets a level where short-dollar profit-taking becomes more likely and where option barriers and stop orders tend to cluster. For rupee and Singapore dollar, where the facts show only spot softness and index strength, the focus stays on fixings, forward points, and the pass-through to imported costs.