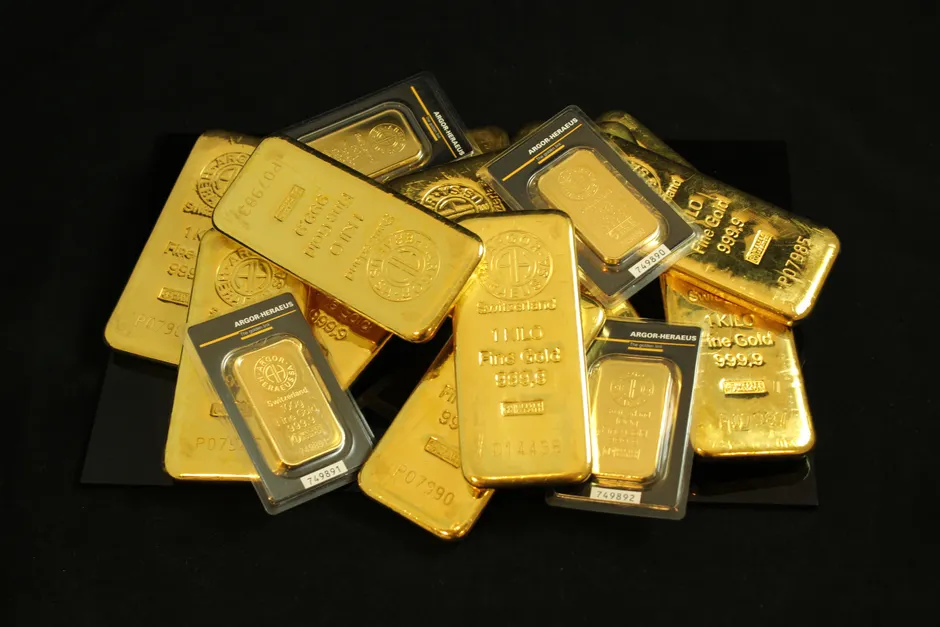
Gold's Bounce off $4,000: Why the Fed's Next Move Matters

Spot gold climbed 1.3% to $4,174.21 per ounce on July 3, 2026, marking its best week in five trading sessions and hitting the highest level since June 23, per Reuters. The metal has stayed above its 21-day moving average—a technical threshold traders use to signal near-term momentum—suggesting the sharp selling that dominated late June has, at least momentarily, eased.
The prior month was rough. On June 24, spot gold fell 3.3% to $3,973.79, its lowest point in over seven months, as a stronger dollar and rising expectations that the Federal Reserve would raise interest rates forced selling across gold markets, Reuters reported. That slide wiped out much of the gains from earlier in the month: as recently as June 17, spot gold had been near $4,299.89, even as the Fed held rates steady that same day and signaled a rate increase would come later in 2026, per Reuters.
The Fed Is the Fulcrum
The June 17 rate hold itself was expected and priced in by markets. What moved gold was what the Fed said next. The forward guidance—the central bank's signal that it would raise rates later—reactivates a core calculation that sits behind every gold trade. Higher interest rates typically push real yields (the return on safe bonds after inflation) higher, assuming inflation expectations don't shift. Real yields are gold's most consistent headwind in the near term, because gold produces no income while bonds do. The June 24 selloff happened once currency markets caught up to that signal.
The recovery began July 1. Spot gold bounced 1.6% to $4,071.04 after touching its lowest level since November the day before. Reuters attributed the move to softer U.S. jobs data than expected and to comments from Fed Chair Warsh that traders read as signaling the Fed was less eager to raise rates immediately. Weak employment numbers weaken the case for higher rates, which in turn makes gold less unattractive relative to bonds; they also suggest that if a rate rise does come, it happens later rather than sooner.
Where Analysts Stand
In late June, the sell-side consensus—reported by Reuters—settled on $4,300 per ounce for the third quarter of 2026 and $4,600 for the fourth quarter. These levels sit well above current spot prices, suggesting analysts view the June drop as temporary rather than a shift in the longer trend.
There is precedent here. UOB's October 2025 outlook for currencies and rates had put gold at $3,900 across all of 2026. Spot blew past that in the first half of the year. An earlier UOB forecast from July 2025 called for $3,500 by the end of Q4 2025; that too proved too low. Forecasters have consistently underestimated gold this cycle, a pattern worth keeping in mind when weighing how much confidence to place in the current consensus of $4,600 for Q4 2026.
What's Underpinning Demand
Three structural forces have kept gold elevated well above what traditional models of interest-rate sensitivity would suggest. Central banks—particularly in emerging markets—have been steadily buying gold to diversify away from dollar-dominated reserves. This demand is largely impervious to short-term rate swings. Geopolitical risk, including US-Iran tensions, has repeatedly provided a floor under the price when other forces weigh it down. And sustained demand from Asia, where gold serves both cultural and portfolio-diversification roles that differ from Western markets, has remained solid.
None of this protects gold from a genuine tightening cycle by the Fed. UOB's broader view, in its Q4 2025 quarterly outlook, assumed no broad recession across the US and Singapore through 2025–2026 and projected a terminal Fed Funds Rate of 3.25%. If that terminal rate is revised significantly higher—which markets began pricing after June 17—the opportunity cost of holding a non-yielding asset rises in ways that structural demand can only partially cushion.
The broader context here is that this is less a story about gold's fundamental value than about the opportunity cost of parking money in an asset that earns nothing. When interest rates rise, that cost rises too.
The Level to Watch
The June 24 low of $3,973.79 is now the key technical level. A sustained break below $4,000 would open the door to November 2025's lows and likely force analysts to rethink their Q3 and Q4 targets. A move back above $4,300—the June 17 level and the Q3 consensus—would reframe the past two weeks as noise rather than a genuine trend shift. As of July 3, the market sits between these two scenarios, with the short-term momentum edge tilting slightly toward the bulls.
The Fed's next decision will determine which interpretation proves correct.