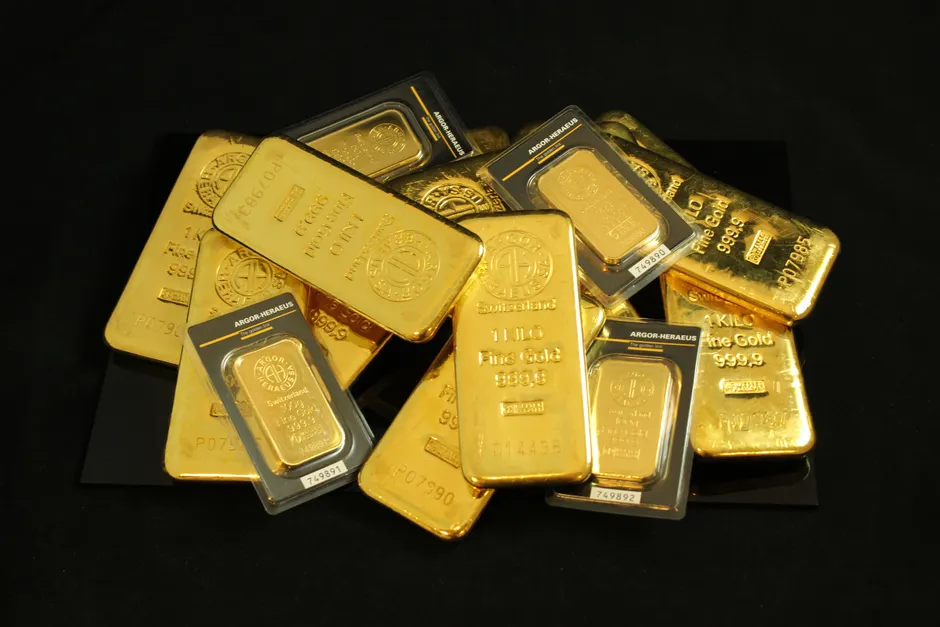
Gold Grinds Higher as Flat Job Openings Data and Mideast Diplomacy Keep Traders Guessing
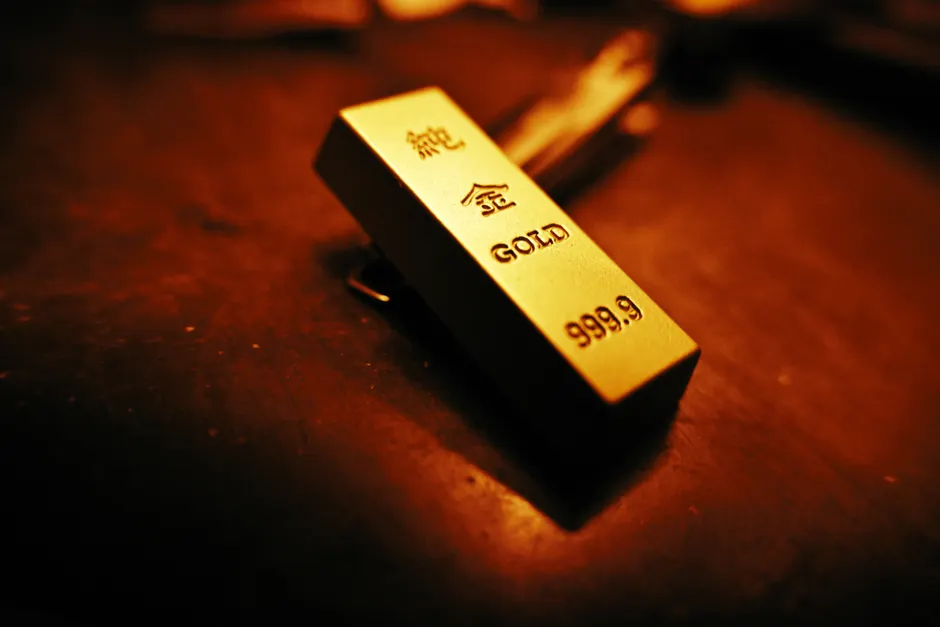
Gold futures finished higher on August 6, 2026, after the June JOLTS report showed job openings were little changed, giving traders little reason to adjust their outlook on the labor market ahead of the next payrolls report. Spot gold rose 0.6% to $4,276.31 an ounce, with markets simultaneously tracking Middle East developments and reconsidering the Federal Reserve's rate path. Gold futures pushed above $4,300 an ounce as Middle East talks eased. WSJ
The session extended a pattern that has defined gold's trading through early August. On August 4, spot gold rose 0.2% to $4,059.81 an ounce as of 0257 GMT and then climbed 1.4% to $4,133 after the job openings data was released. Energy News The move from $4,059 to $4,276 over two sessions reflects a market where each incremental data point, however small, is being mapped onto the Fed's rate-cut timeline with unusual precision.
JOLTS — the Labor Department's Job Openings and Labor Turnover Survey — tracks how many unfilled positions employers are advertising each month. A flat reading matters because it reinforces a "no acceleration, no deterioration" view of the labor market. Job openings that refuse to fall keep wage-growth concerns simmering at the margins, which complicates the case for the Fed to cut rates aggressively. Gold's rally on the news suggests traders are interpreting the absence of labor-market cooling as a signal that the Fed's next move could be delayed, which pushes real rates lower in expectation even if the official policy rate stays put.
Real rates — the nominal interest rate minus inflation — are the key driver here. When real rates fall, the opportunity cost of holding gold drops, because gold pays no interest. That is the classic gold-bullish mechanism: lower expected real yields make a non-yielding asset more attractive by comparison.
Layered on top of that macro signal is a geopolitical premium. Markets tracked Middle East developments throughout the session, with gold futures pushing above $4,300 as talks in the region eased. The dynamic is worth parsing carefully. Easing tensions would, in a purely risk-on framework, reduce gold's safe-haven appeal — investors typically buy gold as a hedge against geopolitical risk, and less risk should mean less demand for that hedge. The fact that gold rose alongside easing suggests traders are pricing a more nuanced outcome: either the de-escalation is fragile enough to keep a risk premium embedded, or the rate-view repricing is doing the heavy lifting and geopolitical headlines are a secondary driver.
That tension between geopolitics and rates is visible further back in the tape. On June 9, 2026, gold prices steadied as traders assessed a fragile ceasefire between Israel and Iran and watched for signs of progress. CNBC A day earlier, a Reuters report noted the US economy added 172,000 jobs in the latest month, gold hit a session low of $4,268.39, and spot gold was steady at $4,334.22 per ounce. Reuters The June 8 spot level of $4,334.22 compared with the August 6 level of $4,276.31 shows gold gave back roughly $58 an ounce over the intervening two months, even as the longer-term trend remained firmly higher. TradingEconomics reported gold's price rose 3.27% over the past month and was up 24.88% as of August 6, 2026. TradingEconomics
The TradingEconomics data also recorded gold at $4,240.13 per troy ounce on August 6, down 0.17% from the previous day. That figure, sourced from a provider with no publication date, conflicts with the WSJ-reported spot level of $4,276.31 (up 0.6%) for the same session. The discrepancy likely reflects timing differences in spot benchmarks or rounding conventions between providers. The WSJ figure, being from a dated source published August 6, takes precedence as the primary reference.
Further back, the May 5 Comex settlement data provides a useful anchor for the structural backdrop. Comex gold settled 0.80% higher at $4,555.80 that day, with Comex silver settling 0.05% higher at $73.108. WSJ Gold at $4,555.80 in May versus $4,276.31 in early August marks a drawdown of roughly $280 an ounce over three months, even as the year-over-year gain held near 25%. The May 5 session was characterized as a "likely technical recovery" — meaning the move was driven by trading mechanics like short-covering or bargain-hunting rather than fundamental shifts in demand. That framing is useful: much of gold's movement through the summer appears driven by positioning flows and technical levels rather than changes in underlying demand.
The March data reinforces that read. Front-month gold futures rose 2.7% to $4,492 a troy ounce on March 27, 2026, and settled the week down 1.7%, with gold posting its fourth consecutive negative week. WSJ A 2.7% single-session rally inside a four-week losing streak is the signature of a market finding a floor, not one in trend reversal. That price level, $4,492 in late March, also brackets the August trading range: gold has oscillated between roughly $4,240 and $4,334 over the summer, sitting below its March spike high.
In terms of what this means for positioning, the convergence of a flat JOLTS print with active Mideast diplomacy creates a two-axis uncertainty that gold is uniquely suited to price. Labor-market stability keeps the Fed on hold; geopolitical flux keeps the risk premium alive. Neither force is decisive enough on its own to drive a trend break. Traders are effectively holding two opposing hedges at the same time, and gold's grind higher reflects the cost of carrying that ambiguity.
The broader context here is that gold's 24.88% year-over-year gain, per TradingEconomics, has compressed into a narrow summer range. The metal is up materially on the year but has spent the last several months consolidating, not extending. A flat JOLTS report and easing Mideast tensions are not the catalysts that break that range. They are the kind of incremental inputs that keep it intact, with each data point nudging gold a few dollars either side of $4,300 while the market waits for a clearer signal on whether the Fed's next move is a cut or a prolonged pause.