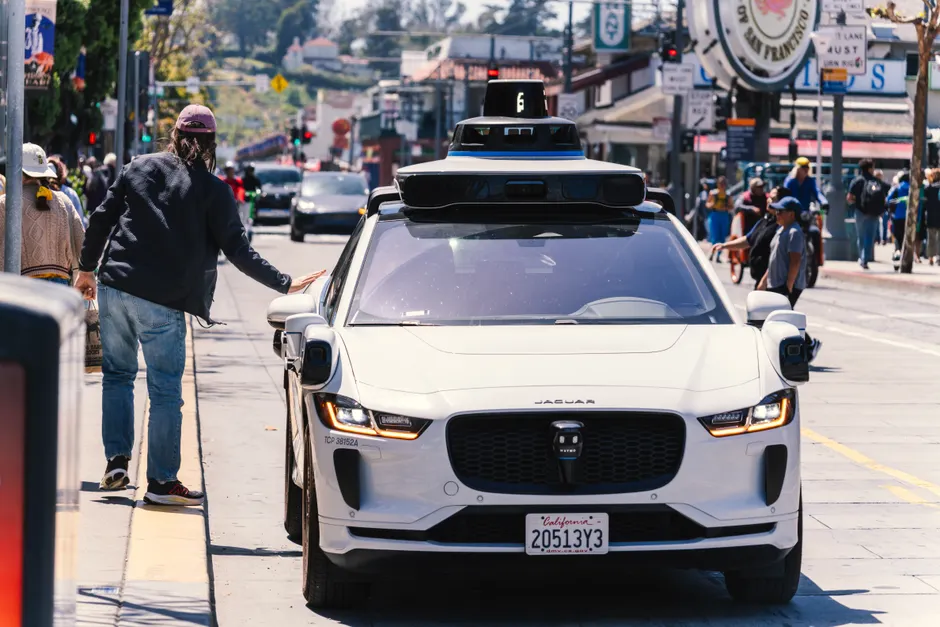
Waymo's 271 Million Driverless Miles Show 82% Fewer Injury Crashes

Waymo analyzed 271 million miles of driverless operation through the end of June and reported 82 percent fewer injury-causing crashes than human drivers. The Verge
The data cover Atlanta, Austin, Phoenix, Los Angeles and the San Francisco Bay Area, adding 50 million driverless miles to the prior report. Waymo now operates nearly 4,000 vehicles in more than 10 U.S. cities, logging about two million driverless miles per week and more than 500,000 paid rides weekly.
The comparison uses human benchmarks matched to the same operating areas. Against that baseline, Waymo reports 95 percent fewer crashes causing serious injury or worse. For injury crashes with vulnerable road users, it reports 93 percent fewer with pedestrians, 86 percent fewer with cyclists, and 82 percent fewer with motorcyclists.
These are company-reported figures. In an independent review, the Insurance Institute for Highway Safety found Waymo vehicles were in 68 percent fewer crashes per vehicle mile traveled than human drivers. IIHS That review found 85 percent fewer single-vehicle crashes per mile and 81 percent fewer injury crashes per mile.
Waymo makes the comparison through a safety data hub that tracks its rate against human rates in each city. The hub sorts crashes into police-reported and injury-reported groups, selects human benchmarks by geography and vehicle type, and normalizes by miles traveled so busier areas do not distort the rate. Per mile and per million miles are simply ways to divide crashes by distance.
An earlier rider-only comparison, with no safety driver on board, gave an example at smaller scale. At 7.1 million miles, Waymo reported 2.1 police-reported crashes per million miles, a unit called IPMM, versus 4.68 for the human benchmark, a 55 percent reduction. That comparison was published in Traffic Injury Prevention, volume 25 supplement 1, pages S66-S77. Waymo was formerly the Google self-driving car project.
The company Safety Impact page cites reductions of more than 80 percent for airbag-deployment crashes and for any-injury-reported crashes, and 94 percent fewer serious injury or worse crashes. The September dataset updates that serious-injury figure to 95 percent on a much larger mileage base.
The U.S. National Highway Traffic Safety Administration opened a probe after a Waymo vehicle struck a child near a school. Reuters The child sustained minor injuries.
The broader context here is what 271 million miles allows analysts to test. Low-frequency, high-severity outcomes start to become measurable at that distance. Single-vehicle, pedestrian, cyclist, and motorcyclist rates are useful because they reflect perception, prediction, and planning by the automated system more than the actions of other drivers. Police-reported and injury-reported rates capture different slices of risk, and per-mile normalization keeps the comparison consistent as service area and ride volume grow.
In my view, the right question is not whether driverless operation is flawless. It is not, and the school-zone incident shows edge cases can still cause real harm when aggregate rates fall. Self-reported data still depends on benchmark choice and reporting thresholds, so independent replication using insurance claims and police reports will carry weight as fleets grow. If reductions of this size hold, the long-term gain is fewer injuries per mile, especially for people outside cars.