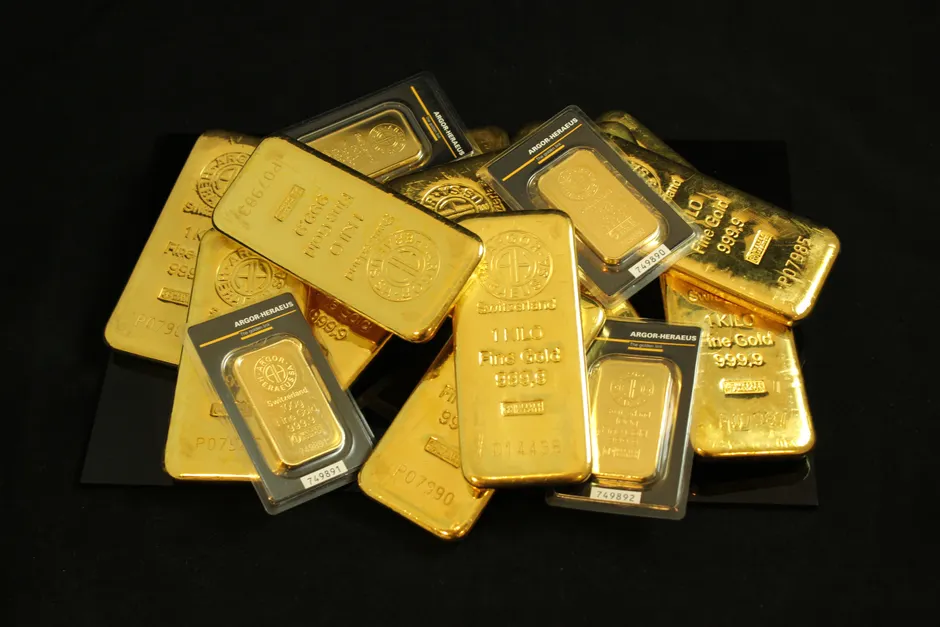
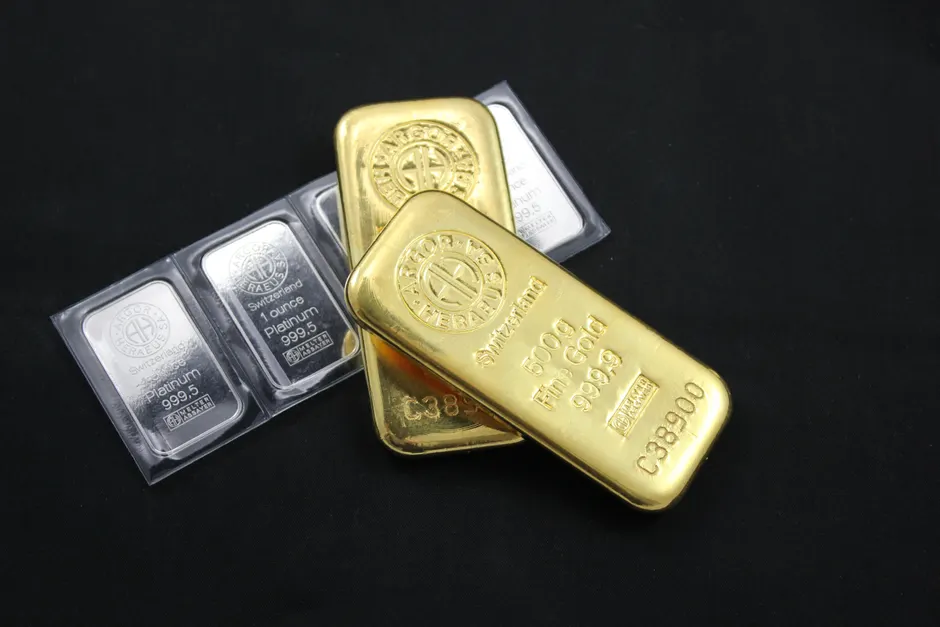
Gold Slipped to $4,150: Why a $300 Drop Matters

Gold traded at $4,150 per ounce at 9:05 a.m. Eastern Time on September 28, 2026, according to Fortune. That level sits well below readings from earlier in September and from the spring.
Gold opened at $4,451.60 per troy ounce (the standard weight for gold) on September 8, 2026, down 0.6% from Friday's closing price, according to Yahoo Finance. On a like-for-like basis, the September 28 level means a decline of roughly $300 per ounce across three weeks. On April 30, 2026, spot gold (gold for immediate delivery) was up 2.2% at $4,639.26 per ounce while U.S. gold futures (contracts to buy later) rose 2% to $4,652.30, according to Kitco.
Reuters reported on January 12, 2026 that in the prior year gold, silver and platinum rose between 65% and 150% to record highs, according to Reuters. MarketWatch had described gold as on a historic run fueled by uncertainty and buying by central banks and individuals, according to MarketWatch.
The all items Consumer Price Index (the main U.S. inflation measure) rose 3.4 percent for the 12 months ending August 2026, the same increase as for the 12 months ending July 2026, according to BLS. The Chained Consumer Price Index for All Urban Consumers (a version that accounts for shoppers switching goods) increased 3.3 percent over the 12 months covered in the August 2026 report. The Bureau of Labor Statistics released the August 2026 Consumer Price Index on September 11, 2026, at 8:30 AM. It has scheduled the Consumer Price Index for September 2026 for release on October 14, 2026, at 8:30 A.M. Eastern Time.
A market strategist told Reuters that gold remains an attractive portfolio diversifier (an asset that does not move in step with stocks) as inflationary pressures, geopolitical instability and dollar weakness could support prices, according to Reuters. MarketWatch separately reported Goldman Sachs's view that historically gold has higher volatility (larger price swings) than U.S. equities and has much larger drawdowns (drops from a peak), according to MarketWatch.
The broader context here is a familiar squeeze for savers and investors. Persistent headline inflation near 3.4% keeps demand alive for assets that do not track regular cash savings. At the same time, the price you start from shapes the protection you get. A $4,150 print after $4,639 spot and a 65% to 150% prior-year advance across precious metals changes the math going forward, even if the hedge idea still holds. Swings cut both ways.
In my view, the Goldman caution deserves weight because the diversifier story sounds strongest after a long climb. Higher swings than stocks with deeper falls from highs means how much is held and how often it is rebalanced matters more than the long-term case. For models built around stocks, gold can steady a portfolio in a shock and still lower risk-adjusted returns if bought after momentum and held without limits. The September fall from $4,451.60 to $4,150 shows that timing effect.
Looking at what this means for the next data point, the October 14 release for September CPI will reset expectations for inflation-adjusted interest rates and, with it, the cost of holding gold that pays no interest. With August headline at 3.4% and chained CPI at 3.3%, steady momentum gives the market no clear sign that inflation is cooling. That keeps both arguments in play. Demand for diversification has basic support. Risk of sharp drops has a price history.