Why Oil Stays Above $100 Even as Gulf Supply Keeps Flowing
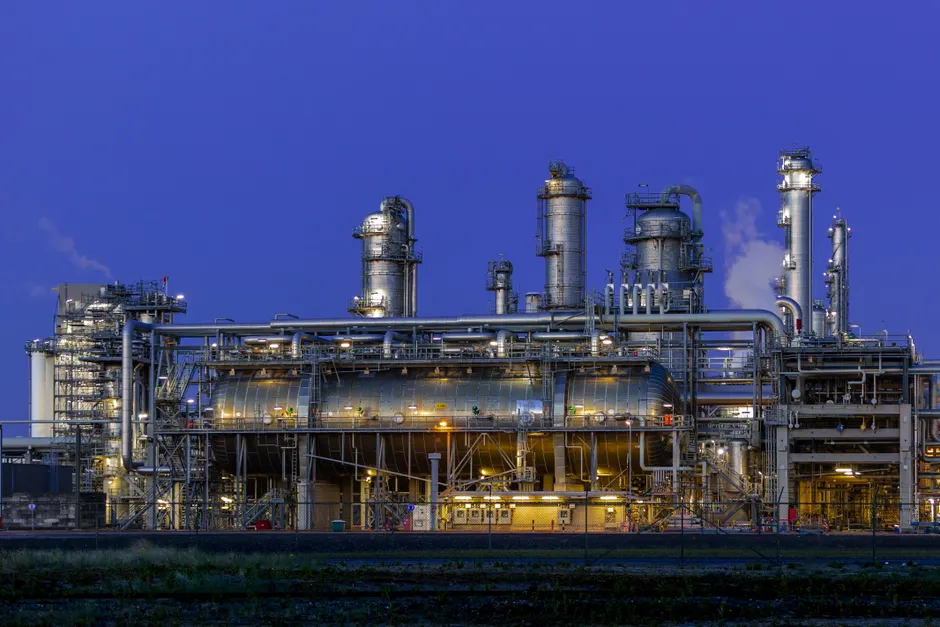
Oil prices settled more than $3 higher on Friday, October 23, 2026, reaching their highest level in nearly six months after Houthi attacks in Saudi Arabia raised concerns about supply. Six days later, The Wall Street Journal ran a piece under the headline "Oil Is Gushing Out of the Gulf. Why Are Prices Still Above $100 a Barrel?" The question is the right one to ask, and the answer sits less in the flow of barrels from the Gulf than in what is left in storage.
The Energy Information Administration (EIA), the statistical arm of the U.S. Department of Energy, estimated that global oil inventories fell by an average of 1.9 million barrels per day in the third quarter of 2026. A barrel per day is a unit of flow, so a draw of 1.9 million barrels per day means the world used roughly that much more crude and refined product each day than it produced, with the gap met from stocks. The same agency projects a further average decline of 0.7 million barrels per day in the fourth quarter. That is a slower pace of drawdown, but it is still a draw. Inventories act as the buffer between supply and demand, and a buffer that keeps shrinking leaves less room to absorb a disruption at any single point in the system.
The tension in that headline is more useful than it first appears. A supply interruption that pushes prices higher, rather than leaving them flat, fits a market short of spare barrels rather than one swimming in them. Footage of oil gushing from a field or terminal describes production at one location. The price reflects the marginal barrel, the last unit needed to balance the market, and expectations about what comes next. Those two can diverge for weeks. In my view, the inventory picture is the more important of the two, because it determines how much margin the market has if the next disruption arrives before the last one is resolved.
For households, the pass-through is the part to watch. The EIA publishes weekly data on U.S. regular gasoline and on-highway diesel prices, plus a separate update on heating oil and propane that runs through the heating season from October to March. Those series show how much of the crude move reaches the pump, the furnace, and the trucking invoice, and how quickly. Crude is only one input. Refining margins, regional stocks, and seasonal demand for distillates all sit between a $100 Brent benchmark, the main global reference price for crude, and what a driver or heating-oil customer actually pays.
The EIA's Weekly Petroleum Status Report also covers the week ending October 23, 2026, with data on crude oil and major products including motor gasoline, distillate fuel oil, jet fuel, residual fuel, and propane. Those weekly figures are the most direct read on whether the quarterly draw is accelerating or easing in U.S. tanks. Traders testing the thesis that inventories are tightening will look there first, then to the monthly Petroleum Supply Monthly series, which breaks out production, imports, exports, and inventories in more detail.
The practical question for anyone exposed to these prices is not whether the headline is accurate. Its premise is supported by the agency data and by the price move itself. The harder question is how long a market with falling stocks and a live supply disruption can hold a triple-digit price without a change in demand, a change in flows, or a change in the risk premium attached to the Gulf. Those are three separate variables. In my view, any forecast that claims to know the path of the other two deserves the same skepticism I would apply to any single-number call on oil.


