Gold Breaks $4,300 as Cooling Jobs Data Shifts the Rate-Path Calculus
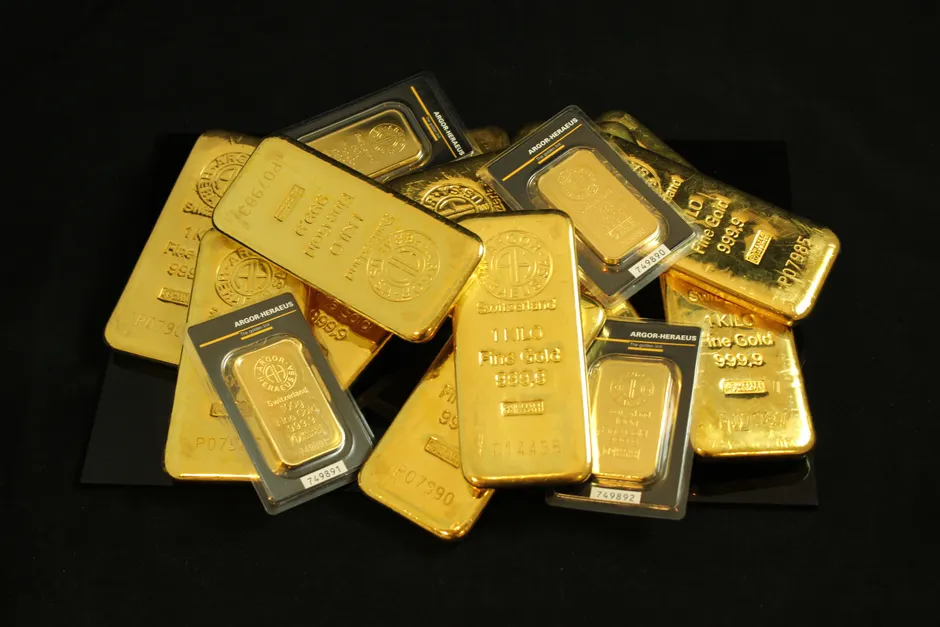
Gold broke out of a six-week trading range and cleared $4,300, Pepperstone reported on August 10, 2026, with easing geopolitical tensions cooling the inflation fears that had previously driven demand for the metal. The breakout follows the consolidation pattern Pepperstone flagged in its July FOMC coverage, when gold traded within a $4,000–$4,200 range and posted a weekly high of $4,166 during the week of the July Federal Open Market Committee meeting.
The August 10 breakout builds on a sharp single-session move three days earlier. Reuters reported that spot gold jumped 2.3% to $4,336.02 per ounce on August 7, 2026 — its highest level since June 17 — after weak U.S. payrolls data dented expectations of further rate hikes. (A "basis point" is one-hundredth of a percentage point; when rate-hike expectations fall, gold tends to rise because gold pays no interest, so lower-rate environments make it more attractive by comparison.) That jobs report shifted the rate-path outlook enough to trigger the move, with bullion then pressing key resistance near $4,350 heading into the next Consumer Price Index release, as Pepperstone noted in its price outlook.
The current price structure sits at a critical technical juncture. Pepperstone's most recent analysis identifies $4,250 as a strong resistance level — a price ceiling where selling pressure has repeatedly blocked further gains — that gold had been consolidating against ahead of what it characterized as a volatile FOMC week. Clearing that barrier and extending above $4,300 puts spot gold within striking distance of the $4,350 resistance zone, with CPI data positioned as the determinant of whether the rally sustains or reverses.
This year's price action has been extraordinary by any historical benchmark. Gold rose 64% in 2025, its largest annual gain since 1979, according to Reuters, before soaring past $5,100 to a record high on safe-haven demand in late January 2026. The December 2025 rally had already pushed gold to an all-time high of $4,441.92 per ounce, with spot prices up 2.2% at $4,434.26 at that time. The subsequent trajectory from those December highs through the January surge past $5,000 and then the retreat to the $4,000–$4,200 July range reflects pronounced volatility around shifting rate expectations and geopolitical risk premia.
The structural case for elevated gold prices rests on two pillars Pepperstone identified in its 2026 outlook: persistent central bank buying and a dollar and rate environment that continues to favor non-yielding assets. Central bank accumulation has been a consistent demand-side factor, providing a price floor independent of speculative positioning. The rate environment, meanwhile, has oscillated between rate-cut expectations that boost gold's opportunity-cost profile and delayed-cut or rate-hike scenarios that temporarily pressure it.
Reuters captured the latter dynamic in March 2026, when gold fell near $4,050 per ounce, weighed down by a stronger U.S. dollar and expectations of further delayed rate cuts. That episode illustrates the sensitivity of the current price structure to rate-path surprises. The August 7 jobs-data rally inverted that pressure, with softer payrolls narrowing the probability of additional hikes.
J.P. Morgan Global Research expects gold to push toward $6,000 per ounce, with its 2026 and 2027 price outlook remaining above current spot levels. That target implies substantial upside from the $4,300–$4,350 zone where gold currently trades, and presupposes that the structural tailwinds Pepperstone cites intensify rather than fade.
The distance between spot prices near $4,350 and the $5,100 January record is roughly 17%. The J.P. Morgan $6,000 target sits a further 18% above that January peak. Whether the metal retraces toward its January highs or consolidates in the current $4,250–$4,350 band depends materially on the next CPI print and the FOMC's policy communication.
The broader context here is that for traders and investors positioned in gold or gold-linked instruments, the CPI release is the near-term inflection point. A soft print reinforces the rate-cut narrative that drove the August 7 rally, while a hot print revives the delayed-cut scenario that pressured gold in March. Pepperstone's own framing — that CPI will "decide whether the rally has legs" — distills the binary cleanly. The structural case for central bank demand and a supportive rate backdrop is medium-term in nature. The immediate direction is a function of inflation data and the Fed's reaction function, and those are unknowns until the print lands.